A/B testing compares two versions of a webpage to see which one performs better. You show Version A to half your visitors and Version B to the other half. Then you measure which version gets more signups, clicks, or sales.
That’s the whole concept. Three sentences.
The execution is where people get lost. So here’s everything you need: how testing works, which tools are worth your money, what the research says about win rates, and how to avoid the mistakes that waste most teams’ time.
What is A/B testing?
You have a webpage. Maybe it’s your homepage, a pricing page, or a signup form. You think a different headline might get more people to click. A/B testing lets you find out without guessing.
Here’s the process:
- Pick what to change. A headline, a button, a call-to-action, an image. One thing.
- Create Version B. Your current page is Version A (the original). Your change becomes Version B.
- Split traffic. Half your visitors see A, half see B. The split is random.
- Wait for data. The test runs until you have enough visitors for a reliable answer.
- Read the results. One version wins, or they perform about the same. Both outcomes are useful.
| Step | What happens | What you do |
|---|---|---|
| Setup | Pick a page and an element to test | 3 minutes in most tools |
| Split | Visitors randomly see Version A or B | Nothing. The tool handles this |
| Measure | Conversions are tracked per version | Check back in a week or two |
| Decide | One version gets more conversions | Keep the winner, or test again |
The term “split testing” means the same thing. Some people use it interchangeably, some draw a technical distinction between the two. For most purposes, they’re the same idea.
With Kirro, setup takes about three minutes. Paste a small script on your site, open the visual editor, click the element you want to change, and hit start. No code. No developer.
What can you test?
Almost anything visible on a page. Headlines, button text, images, hero sections, form layouts, pricing displays, page structure. If a visitor can see it, you can test it.
How do you know if a test worked?
After enough visitors have seen both versions, the tool runs the numbers. You’ll see something like: “Version B gets 23% more signups. Kirro is confident this works.” Or: “Both versions performed about the same.” Both answers are useful. A “no difference” result means your original was already decent. That’s good information.
The key word is “enough visitors.” Run a test with 50 visitors and you’re basically flipping a coin. Run it with 5,000 and you’re getting a real answer. How many you need depends on your traffic and the size of the change you’re testing. (More on sample size later.)
When you’re testing multiple elements at once (a headline AND a button AND an image), that’s called multivariate testing. It needs much more traffic. Most small businesses don’t need it. Start with one change at a time.
Why A/B testing matters
According to BuiltWith data compiled by Convert.com, only 0.2% of all websites use any A/B testing tool. Even among the top 10,000 highest-traffic sites, just 32% run tests.
That means the vast majority of businesses are guessing what works. And guessing is expensive.
Here’s what happens when companies actually test:
| Example | What was tested | Result | Source |
|---|---|---|---|
| Bing (Microsoft) | Ad headline layout | 12% revenue increase (~$100M/year in the US) | HBR, 2017 |
| Obama campaign | Signup page variations | 140% more signups, $75M in added donations | TrueList |
| Bing page speed | 100ms faster load time | $18M additional annual revenue | HBR, 2017 |
These are big companies with big numbers. But the principle scales down perfectly.
Say your landing page converts at 2% and gets 10,000 visitors a month. That’s 200 conversions. A better headline pushes it to 2.5%. Now you’re getting 250 conversions. Same traffic, 50 more customers every month, zero extra ad spend. Over a year, that’s 600 additional customers from a single headline test.
And the wins compound. Run 10-15 tests a year, find 3-4 winners, and each improvement stacks on top of the last. A 2% conversion rate becomes 2.5%, then 2.8%, then 3.1%. Your website gets better at turning visitors into customers without any increase in traffic budget.
This is why Ron Kohavi, who ran experimentation at Microsoft, Amazon, and Airbnb, calls controlled experiments “the best scientific way to establish causality”. You’re not guessing what works. You’re measuring it.
Our take: Most A/B tests don’t produce winners. At Google and Bing, only 10-20% of experiments show positive results. That’s normal. The 10-20% that DO win more than pay for the effort. Testing isn’t about winning every time. It’s about finding the wins that matter.
Booking.com runs roughly 1,000 tests at any given time. Google runs over 10,000 per year. They don’t do this because every test is a slam dunk. They do it because the ones that hit, hit big.
Frequently asked questions
What is A/B testing?
A/B testing shows two versions of a webpage (or email, or ad) to different groups of visitors. You measure which version gets more conversions, whether that’s signups, purchases, or clicks. The version that performs better wins.
It’s the simplest way to make data-backed decisions about your website instead of guessing. You don’t need a statistics degree or a dedicated CRO team. With modern tools like Kirro, you can set up and run a test in a few minutes.
How long should an A/B test run?
At minimum, two weeks. Even if you hit your target sample size faster, you need at least one full business cycle to account for weekday vs weekend differences.
The biggest mistake is stopping a test early because it “looks like” a winner. Checking results before the test is done inflates your false positive rate from 5% to 26%. Let the test run.
What is a good sample size for A/B testing?
There’s no universal number. It depends on your current conversion rate, the minimum improvement you’d find meaningful, and your desired confidence level.
Rough benchmark: most tests need at least 350-1,000 conversions per version. Sites with fewer than 10,000 monthly visitors should focus on testing big, obvious changes (headlines, layout) rather than subtle tweaks. Use our free sample size calculator to get a number for your situation.
What’s the difference between A/B testing and multivariate testing?
A/B testing compares two versions with one change. Multivariate testing changes multiple elements at the same time and measures how they interact.
The tradeoff: multivariate tests reveal more but need significantly more traffic (often 10x or more). In practice, less than 1% of all tests run are multivariate. For most businesses, A/B testing is the right starting point. Test one thing, get a clear answer, move on.
Ready to stop guessing and start measuring? Try Kirro free for 30 days. Set up your first test in 3 minutes. No credit card. No setup guide. See what actually works.
A/B Testing Tools & Software
The A/B testing tools market is approaching $1 billion and growing at about 14% per year. Yet only 11.5% of the top million websites actually run a testing tool. That’s a lot of sites leaving money on the table.
The market itself is lopsided. Most tools were built for enterprise teams with dedicated optimization specialists and six-figure budgets. If you’re a marketer or founder at a smaller company, the options look expensive and complicated. They don’t have to be.
When Google Optimize shut down in September 2023, an estimated 2-3 million websites lost the only simple, free testing tool that worked inside their Google stack. That gap still hasn’t been properly filled. Enterprise tools are too expensive. Developer tools assume you write code.
Kirro was built for that gap. EUR 99/month, unlimited tests, unlimited visitors, visual editor, GA4 integration. No per-visitor pricing that punishes you for growing. Try it free for 30 days.
How to pick the right tool
A/B testing tools fall into four categories. Knowing which one fits saves you from buying a race car when you need a bicycle.
| Category | Who it’s for | Price range | How it works | Examples |
|---|---|---|---|---|
| Visual editor | Marketers, founders, small teams | $0-$1,200/year | Point-and-click changes on your live site. No code. | Kirro, Crazy Egg, VWO |
| Full-stack platform | Mid-market to enterprise CRO teams | $3,500-$100,000+/year | Visual editor plus server-side testing, personalization, and analytics. | VWO, Convert, Optimizely, AB Tasty |
| Developer-first | Engineering teams, feature flagging | $0-$5,000/year | Code-based. Tests live in your codebase, not a visual editor. | GrowthBook, Statsig, LaunchDarkly |
| Server-side only | Large sites needing zero-flicker performance | $10,000+/year | Tests run on your server before the page loads. Fastest, but requires dev work. | Optimizely Full Stack, Kameleoon |
Visual editor tools are the starting point for most small teams. You click on a headline, change it, and hit start. Kirro fits here. So does VWO’s basic plan and Crazy Egg.
Full-stack platforms bundle everything: visual editor, server-side tests, personalization, heatmaps, session recordings. VWO and Optimizely live here. You pay for the bundle whether you use all of it or not.
Developer-first tools are free or cheap but need someone who can write code. GrowthBook is open source and genuinely free. PostHog and Statsig have generous free tiers. If you have a developer on the team and a data warehouse, these are worth a look. If you don’t, skip them.
Pricing models matter too. Some tools charge per seat (per person who logs in). Others charge per MTU (monthly tested users, meaning visitors who see a test). MTU pricing means your bill goes up as your traffic grows. Seat pricing stays flat. Kirro charges a flat EUR 99/month regardless of traffic or team size. That’s unusual. Most tools in this space charge more as you grow.
One thing every “best tools” roundup skips: only about 1 in 8 A/B tests produce a clear winner. The tool you pick matters less than actually running tests consistently. A EUR 99/month tool used weekly beats a $36,000/year tool used quarterly.
Find the right guide for your question
Each of these posts goes deep on a specific angle. Here’s where to start based on what you’re looking for.
Want a full buyer’s guide? Our A/B testing software comparison reviews 13 tools side by side. Total cost of ownership, real pricing (not just the sticker), and tradeoffs nobody else mentions. It’s the deep dive.
Short on time? The best A/B testing tools post is the 5-minute version. Five picks organized by use case: best for small teams, best for enterprise, best for ecommerce, best for developers. Clear winner recommendation upfront.
Need redirect testing? Split testing (sending visitors to completely different URLs) is a different job than element-level A/B testing. Our split testing software guide covers 8 tools that handle real URL redirects and explains when you need that instead of standard A/B testing.
Building a mobile app? Mobile testing has unique headaches: app store review delays, version fragmentation, and smaller sample sizes. The mobile app A/B testing guide covers the best tools and what makes mobile different from web testing.
The bigger picture
A/B testing tools are one piece of the conversion puzzle. The full CRO stack includes heatmaps, session recordings, surveys, and analytics alongside testing. Our CRO tools guide breaks down the full toolkit.
For the fundamentals of A/B testing itself (how it works, what to test first, how to read results), start with our A/B testing pillar guide. Everything in this section lives under that umbrella.
The 8 best A/B testing tools for mobile apps in 2026
Firebase, Statsig, and PostHog are the best A/B testing tools for mobile apps if you want to start without a massive budget. Optimizely and LaunchDarkly lead fo ...
 Randy Wattilete
 The 7 best multivariate testing software tools in 2026
A/B testing agency: when you need one (and when a tool does the job)
Best A/B testing tools in 2026 (the 5-minute version)
CRO Tools & Software
Most “CRO tools” articles list 15 products and tell you to pick a few from each category. That’s advice built for teams with dedicated optimization specialists and five-figure budgets. If you’re a marketer or founder at a smaller company, you need a different approach.
Here’s the reality: only 0.2% of websites use any A/B testing tool at all. The gap isn’t knowledge. It’s that the industry keeps selling full “CRO platforms” to people who need one or two tools.
A/B testing tools and CRO tools are different things, even though people use the terms like they mean the same thing. An A/B testing tool does one job: it shows two versions of a page to different visitors and tells you which one performs better. A CRO tool is a broader category that includes heatmaps, session recordings, surveys, form analytics, and personalization alongside testing. Think of A/B testing as one wrench. CRO tools are the whole toolbox.
The question is whether you need the toolbox or just the wrench. For most small teams, the answer is the wrench plus one or two free tools you probably already have access to.
The 3-tool stack that covers 90% of what you need
This isn’t a theoretical framework. It’s what actually works for small teams:
Google Analytics 4 handles the “measure” part. Track traffic, conversions, funnels, and user behavior. It’s free and it’s the foundation.
Microsoft Clarity handles the “watch” part. Free heatmaps and session recordings with no limits on traffic or sessions. See where people click, how far they scroll, and where they rage-click. No credit card, no caps, no catch. Hotjar still owns 55% of the heatmap market, but Clarity does the same core job for zero dollars.
Kirro handles the “test” part. Change a headline, swap a button, try a new hero section. EUR 99/month, unlimited tests, unlimited visitors, 9KB script. The visual editor means no developer needed.
Total cost: EUR 99/month. The enterprise equivalent (Optimizely + Hotjar Business + GA4 360) runs $50,000+ per year. Same workflow. Different price tag.
Our take: The VWO and AB Tasty merger in January 2026 signals where the industry is heading. PE-backed consolidation pushes tools upmarket and prices up. The gap for small teams keeps getting wider. Building your stack from focused, affordable tools protects you from that trend.
What is a CRO tool (and do you actually need one)?
A conversion rate optimization tool is software that helps you get more from the traffic you already have. Instead of spending more on ads, you improve what your website does with the visitors who show up.
Some CRO tools watch what people do on your site. Others ask them why they did it. And a few let you test changes to see if your fix actually works. They’re different jobs, and no single tool does all of them well.
The trap? People hear “CRO tools” and immediately think they need an eight-tool stack. Heatmaps, session recordings, A/B testing, personalization, surveys, form analytics, plus a dashboard to track the dashboards.
You don’t. Not yet.
77% of companies say they run A/B tests (see our guide to A/B testing for what that involves), but only 0.2% of all websites actually use testing tools. Most businesses are still at the “understand what’s happening” stage. And that’s fine. Start there.
Our take: If you don’t know why visitors are leaving, don’t buy a tool to test changes. Start by watching. Then ask. Then test. In that order.
One more thing. A/B testing needs roughly 1,000 conversions per month to produce reliable results. Below that, tests take months to tell you anything useful. If you’re not there yet, free observation tools will teach you more than any testing platform.
What are the 6 types of CRO tools, and when do you need each?
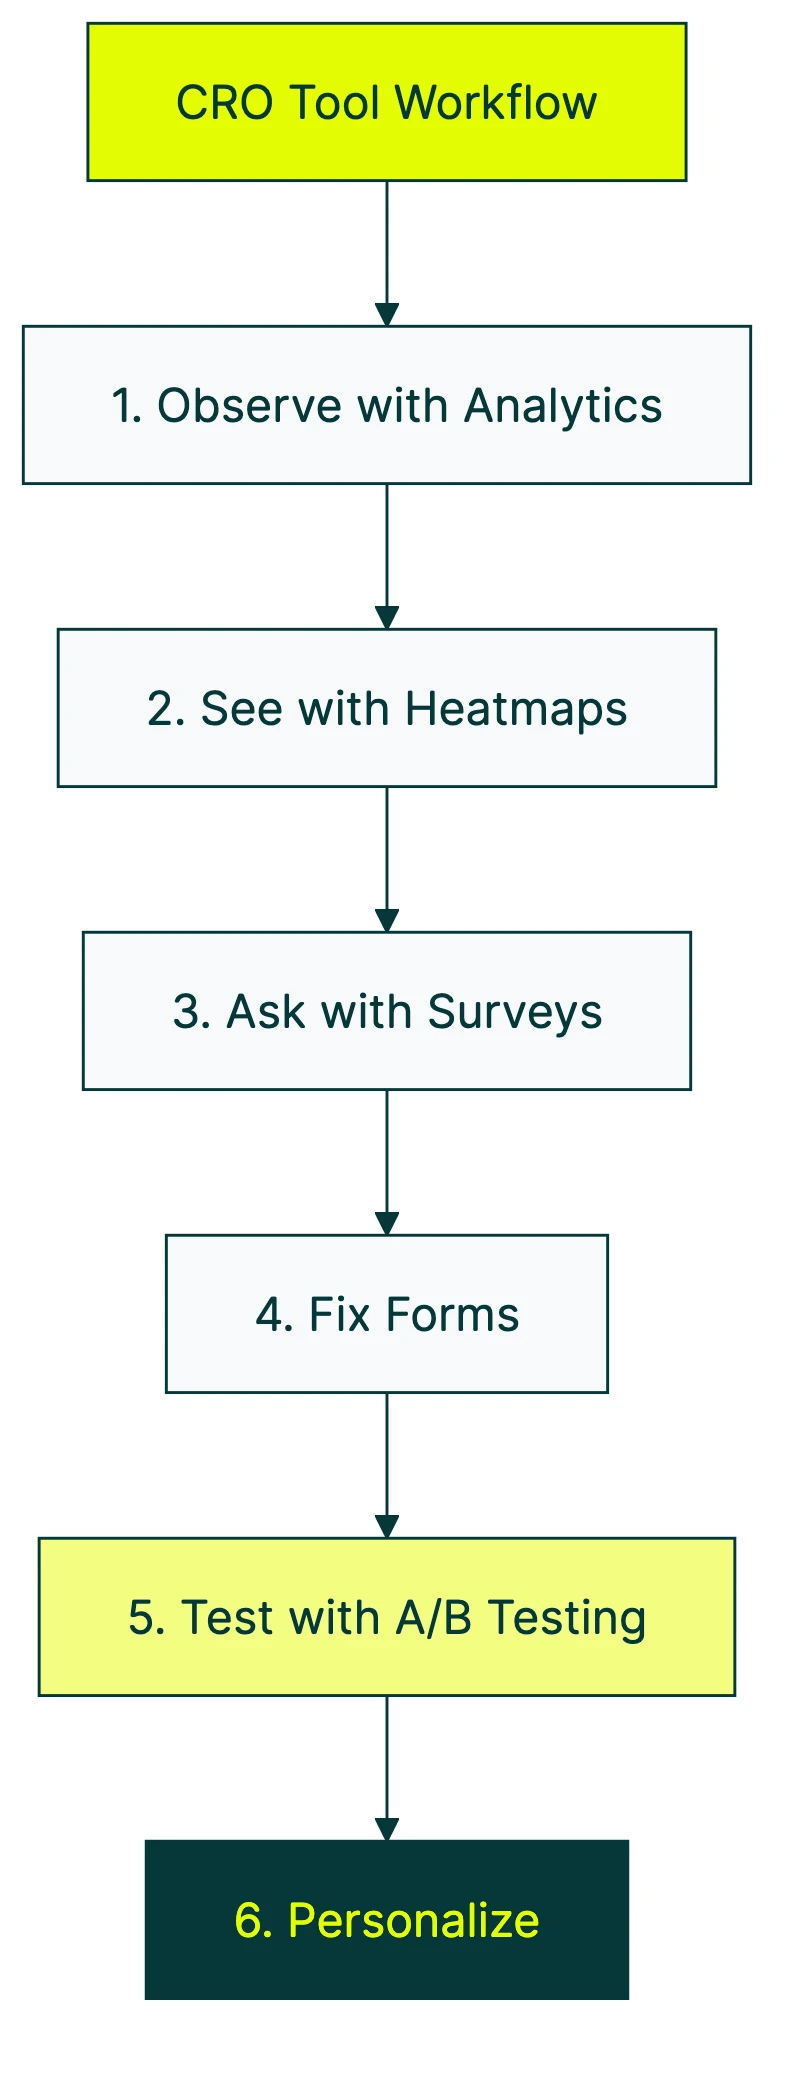
Every conversion optimization tool fits one of six categories. They follow a natural workflow. And the order matters more than most articles admit.
- Web analytics (measure what’s happening)
- Behavior analytics like heatmaps and session recordings (see what’s happening)
- Surveys and feedback (ask why it’s happening)
- Form analytics (find where forms break)
- A/B testing (test your fixes)
- Personalization (tailor experiences by audience)
Categories 1 through 3 are where everyone starts. They’re cheap or free, and they work with any traffic level. Categories 4 through 6 only make sense after you’ve done the research.
Buying a testing tool before you know what to test is like buying gym equipment before you have a workout plan.
For a walkthrough of how these tools work together to drive conversions, CXL covers the key concepts:
The CRO software market hit $10.4 billion in 2024 and is growing at 12.2% per year. But what’s worth buying depends on where you are in the process. Not what’s trending.
Best CRO tools by category
Here are the top conversion rate optimization tools in each category. We’re listing what actually works for small and mid-sized businesses. Not the 34-tool megalist that leaves you more confused than when you started. If you run an online store, our best CRO tools for ecommerce guide focuses on tools for product pages, checkout, and cart flows.
Web analytics tools
Google Analytics 4 is free and covers 99% of what small businesses need. It tracks traffic, conversions, user behavior, and funnels. It’s not exciting. It’s essential.
Mixpanel is worth a look if you run a SaaS product and want deeper funnel analysis. Free tier covers most use cases.
Skip paying for analytics unless you’ve genuinely outgrown GA4. Most people haven’t.
Heatmap and session recording tools
For a detailed comparison of the top products in this category, see our session replay tools roundup. Short version: this category had a quiet revolution. Microsoft Clarity launched as a completely free tool with unlimited heatmaps, unlimited session recordings, and no website limits. That changed the math for everyone.
Before Clarity, you’d pay Hotjar $32/month or more for limited session recordings. Now you can see where visitors click, scroll, and rage-click, all for zero dollars. If you’re weighing your options, our Hotjar alternatives guide covers the full list.
Nielsen Norman Group research found 94% of people cite navigation as the most important website feature. Heatmaps show you exactly where yours is confusing them.
Here’s what the paid tools add:
| Tool | Price | What you get beyond Clarity |
|---|---|---|
| Hotjar | $32-213/month | Surveys, longer data retention, feedback widgets |
| Crazy Egg | $29-599/month | Built-in A/B testing, snapshots |
| FullStory | $299+/month | Enterprise analytics, error tracking |
Only pay for heatmaps if you need surveys bundled in (Hotjar) or built-in testing (Crazy Egg). For observation alone, Clarity is enough.
Heatmaps and recordings do different jobs, by the way. A heatmap shows the pattern: everyone clicks here, nobody scrolls past there. A recording tells the story: this person got confused on the pricing page and left.
Use both. Heatmaps for WHERE. Recordings for WHAT. Surveys for WHY.
Survey and feedback tools
Data shows you what people do. Surveys tell you why. This combination is where real CRO insights come from.
- Hotjar Surveys ($39+/month) works best if you already use Hotjar for heatmaps. Everything lives in one place.
- Qualaroo has a free forever plan. On-site surveys that pop up at the right moment. Good enough for most teams.
- SurveyMonkey (free tier, $25+/month) has the most question types and templates. Better for longer research surveys than quick on-site questions.
Form analytics tools
If checkout or signup forms are your main conversion bottleneck, dedicated form analytics pay for themselves fast. Baymard Institute found the average checkout has 23.48 form elements. The ideal number is 12. That gap is where conversions die.
Zuko’s research backs this up. One company cut their form from 11 fields to 4 and saw a 160% jump in conversions. Multi-step forms beat single-page forms by 35-214%.
- Zuko (formerly Formisimo, ~$100-300/month) is the specialist. Deep form analytics with field-level drop-off data.
- Lucky Orange ($39/month) bundles form analytics with heatmaps and recordings. Good budget option if you want everything in one tool.
Most behavior analytics tools now include basic form tracking. You only need a dedicated form tool if forms are your primary conversion killer.
A/B testing and experimentation tools
This is where the conversation gets real. And where the most money gets wasted. (For a deeper look at just this category, see our best A/B testing tools roundup.)
A/B testing tools let you show two versions of a page to different visitors and measure which one gets more conversions. Change a headline, swap a button color, rewrite your pricing page. The tool splits traffic and does the math.
Only 12.5% of A/B tests produce winning results. Not because testing is broken, but because most people skip the research (categories 1 through 3 above) and test random changes.
A Harvard/Duke study of 35,262 startups found that A/B testing accelerates both success AND failure. Test the right thing, you win faster. Test the wrong thing, you burn through time and money.
The conversion optimization software market for testing, at a glance:
| Tool | Best for | Starting price | Free tier |
|---|---|---|---|
| Kirro | Small teams, solo founders | EUR 99/month | 30-day trial (full product) |
| VWO | Mid-market, all-in-one | ~$314/month | Limited free plan |
| Optimizely | Enterprise | ~$36,000/year | No |
| GrowthBook | Developer teams | Free (open source) | Yes (self-hosted) |
| Convert | Privacy-focused teams | $399/month | No |
Kirro fills the gap that Google Optimize left when it shut down in September 2023. Simple setup, visual editor, Bayesian stats that work with smaller traffic. EUR 99/month with unlimited tests and unlimited visitors.
The script is 9KB. Most competitors load 100-200KB. That matters when 40% of people leave sites that take more than 3 seconds to load.
Honest trade-offs: Kirro is web-only. No server-side testing. No feature flags. If you’re a marketer who wants to test a headline without filing a dev ticket, it’s built for you. It’s especially useful for landing page optimization where quick headline and CTA tests make the biggest difference. Pair it with landing page analysis tools to identify what to test before you start experimenting. Want to test SEO changes instead of conversion changes? That’s a different category with different tools. Need the full workflow? Our landing page split testing guide covers everything from page selection to reading results. If you need enterprise-scale multivariate testing, look at VWO or Optimizely. For split testing software that handles redirect tests specifically, we’ve compared eight tools.
VWO starts around $314/month and includes heatmaps, surveys, and session recordings alongside testing. Can’t decide between the big two? Our VWO vs Optimizely comparison covers pricing and features. Want Optimizely pricing details? We broke down the real costs. Shopping for cheaper Optimizely alternatives? We covered seven of them. If you’re deep in Adobe’s ecosystem, our guide to Adobe Target A/B testing covers whether that integration justifies the price tag.
GrowthBook is free and open-source, but you need developers to set it up. If “self-hosted” sounds like a foreign language, this isn’t your tool.
The Google Optimize shutdown left millions of marketers without a simple, free testing tool. VWO responded by reducing pricing in late 2024. But the gap for affordable, no-code testing is still wide open. See our full list of Google Optimize alternatives for more options.
Personalization tools
Personalization means showing different content to different visitors. Based on who they are, where they came from, or what they’ve done before.
It sounds amazing. In practice, it requires 10,000+ visitors per segment, deep CRM integration, and 1-3 months of setup work.
McKinsey research says personalization drives 10-30% improvement in marketing ROI. But that’s for companies with the traffic and data to pull it off.
- Mutiny (~$500-2,000/month) is built for B2B SaaS. Personalizes pages by company, industry, or campaign.
- Dynamic Yield (enterprise, custom pricing) is the full platform. AB InBev and IKEA use it. You probably don’t need it yet.
Save personalization for when your basic CRO strategy is mature. Clear headlines, working forms, and fast pages will beat any personalization engine running on top of a confusing website. That said, AI conversion rate optimization is making personalization more accessible for smaller teams. And if tools alone aren’t moving the needle, it might be worth exploring when to hire a CRO consultant instead.
How do you choose the right CRO tools?
Every “best CRO tools” article lists 15-30 tools and leaves you to figure out which ones to actually buy. That’s not helpful. What you need depends on where you are. Before buying anything, start with a CRO audit to know what problems you’re solving.
CRO expert Charles Burdett recommends a minimum of 5,000 visitors per week before A/B testing makes sense. Below 10,000 monthly visitors, testing shouldn’t be your primary tool. Here’s a framework based on where you are.
Phase 1: Observe (any traffic level)
Tools: GA4 + Microsoft Clarity (both free)
What you’re doing: Watching. Where do people land? Where do they leave? What do they click? This works even if you get 100 visitors a month. You’ll spot obvious problems (broken pages, confusing navigation, dead-end content) without spending a dollar.
Phase 2: Understand (1,000+ visitors/month)
Add Hotjar or Qualaroo ($0-39/month) and start asking questions. Run a quick on-site survey: “What almost stopped you from signing up?” or “What were you looking for that you couldn’t find?”
Five survey responses often teach you more than 5,000 pageviews. Combine them with your heatmap data. Now you know what’s happening AND why.
Phase 3: Test (1,000+ conversions/month)
Tools: Add an A/B testing tool like Kirro or VWO ($99-314/month)
What you’re doing: Testing the fixes you found in phases 1 and 2. You watched, you asked, now you’re testing your best ideas. This is where conversion rate optimization gets measurable.
Lower traffic? Conversion Rate Experts says you can accept 85-90% confidence instead of the standard 95%. Test smaller changes (button clicks, micro-conversions) instead of waiting months for enough purchase data.
If you want to run your first test in about three minutes, that’s literally how long Kirro’s setup takes.
Phase 4: Personalize (10,000+ visitors per segment)
This is Mutiny or Dynamic Yield territory ($500-2,000+/month). B2B visitors see one hero. Returning customers see another. Powerful, but only after the basics convert well.
McKinsey reports $1.7 trillion in revenue is unlockable through personalization. That number is for companies with serious data infrastructure, though. Not for a 10-page marketing site.
Budget quick-reference
| Monthly budget | Recommended stack |
|---|---|
| $0 | GA4 + Microsoft Clarity + Qualaroo (free tier) |
| $50-200 | Above + Hotjar Plus or Crazy Egg |
| $200-500 | Above + Kirro or VWO Growth |
| $1,000+ | Full stack with testing + personalization |
Our take: Most companies jump straight to Phase 3 (testing) without doing any research in Phases 1 and 2. That’s why 87.5% of A/B tests don’t produce winning results. Two weeks of heatmaps and five survey responses will make every test after that dramatically better. The research is free. The testing doesn’t have to be expensive. The order matters.
CRO tools comparison table
| Tool | Category | Starting price | Free tier | Best for | Min. traffic |
|---|---|---|---|---|---|
| Google Analytics 4 | Analytics | Free | Yes | Everyone | Any |
| Mixpanel | Analytics | Free tier | Yes | SaaS product teams | Any |
| Microsoft Clarity | Heatmaps, recordings | Free | Yes | Everyone | Any |
| Hotjar | Heatmaps, surveys | $32/month | Limited | Teams wanting heatmaps + surveys | Any |
| Crazy Egg | Heatmaps, testing | $29/month | No | Quick visual insights | Any |
| FullStory | Session analytics | $299/month | No | Enterprise teams | High |
| Qualaroo | Surveys | Free | Yes | On-site surveys | Any |
| SurveyMonkey | Surveys | Free tier | Yes | Research surveys | Any |
| Zuko | Form analytics | ~$100/month | No | Checkout/signup forms | Any |
| Lucky Orange | All-in-one | $39/month | No | Budget all-in-one | Any |
| Kirro | A/B testing | EUR 99/month | 30-day trial | Small teams | 1,000+ conv/month |
| VWO | A/B testing + more | ~$314/month | Limited | Mid-market | 1,000+ conv/month |
| Optimizely | A/B testing | ~$36,000/year | No | Enterprise | High |
| GrowthBook | A/B testing | Free | Yes (self-host) | Developer teams | 1,000+ conv/month |
| Convert | A/B testing | $399/month | No | Privacy-focused | 1,000+ conv/month |
| Mutiny | Personalization | ~$500/month | No | B2B SaaS | 10,000+ per segment |
| Dynamic Yield | Personalization | Custom | No | Enterprise | High |
What are the most common CRO tool mistakes?
Buying testing tools without enough traffic. This is the number one waste of money in CRO. If you’re getting 500 conversions a month, an A/B test comparing two headlines needs six months to reach a result. Start with free observation tools until your traffic justifies testing. (Check if your traffic is ready with our conversion rate guide.)
Tools can’t fix bad ideas. Only 1 in 8 tests wins, and a Patreon product manager put it best: “A/B testing is not insurance for critical thinking.” Two weeks of heatmap data and five survey responses will give you better test ideas than a month of guessing. The most common A/B testing mistakes? They all come from skipping the research.
Over-buying enterprise tools for SMB needs. If you’re a 20-person company, you don’t need Optimizely. Or Dynamic Yield. Or a $2,000/month tool stack. Speero’s 2025 maturity research found that even mature programs struggle to move past vanity metrics. More tools won’t solve that. Better thinking will.
Then there’s tool overlap. Hotjar does heatmaps. So does Crazy Egg. So does Microsoft Clarity. So does Lucky Orange. If you’re paying two vendors for the same heatmaps, you’re paying twice for one job.
Forgetting about page speed. A/B testing tools add JavaScript to your site. Some add a lot. HBR research warns about hidden costs of testing infrastructure, and page speed is one of them. Kirro’s script is 9KB. Some competitors load 100-200KB. That gap matters when slow pages directly hurt conversions.
And one that’s easy to miss: Harvard Business Review found that looking at averages hides what’s actually happening. A change might help mobile visitors and hurt desktop visitors. The average looks flat, but half your traffic is getting a worse experience. Segment your results. Always.
Which post should you read next?
Every post in this cluster covers a different part of the CRO toolkit. Start with the one that matches where you are right now.
Ready to buy software? The CRO software buyer’s guide is for people who already know what they need and want to compare specific products. It covers pricing, stacks by budget tier, and the trade-offs between all-in-one platforms and best-of-breed setups. Includes the post-merger VWO/AB Tasty picture.
Need to understand user behavior first? Our session replay tools roundup compares every major heatmap and recording tool, starting with free options. If you want to see what visitors actually do on your site before deciding what to test, start there.
Thinking about switching from Hotjar? The Hotjar alternatives guide covers why teams leave (pricing, session limits on the free plan) and what to use instead. Includes a head-to-head with Microsoft Clarity and the full comparison with FullStory, Mouseflow, and Lucky Orange.
Just want the testing category? Our best A/B testing tools roundup covers that one category in depth, by team size and budget.
The thread connecting all of this
Most businesses get stuck because they either skip straight to testing (without knowing what to test) or they buy observation tools and never act on what they find.
The posts in this cluster cover the full picture, from choosing the right tool categories to comparing specific products. The parent A/B Testing pillar page ties this into the broader testing and experimentation strategy.
When you’re ready to start testing, Kirro’s free trial gives you 30 days with the full product. No features locked. No credit card required. Pair it with Clarity and GA4, and you’ve got the same CRO workflow the enterprise teams use.
FAQ
What is a CRO tool?
Software that helps you understand visitor behavior and test improvements to get more conversions from your existing traffic. Instead of paying for more visitors, you make better use of the ones you have. There are six main types: analytics, heatmaps, surveys, form analytics, A/B testing, and personalization.
How do I choose a CRO tool?
Start with free observation tools. GA4 for traffic data, Microsoft Clarity for heatmaps and session recordings. These work at any traffic level and cost nothing. Only add paid tools when you’ve identified a specific problem to solve and have enough traffic to test solutions properly. Our decision framework above breaks it down by phase.
Are CRO tools worth it?
They can be. CRO tools deliver an average 223% ROI according to a VWO study. But only if you have enough traffic and a research-first approach. Buying tools without a strategy is like buying gym equipment without a workout plan. The equipment isn’t the problem.
What’s the best free CRO tool?
Microsoft Clarity. Unlimited heatmaps, unlimited session recordings, completely free. No catch. Pair it with Google Analytics 4 and you’ve got a solid foundation for $0. Most small businesses can run on just these two for months before needing anything paid.
How many CRO tools do I need?
Two or three. An analytics tool (GA4), a behavior tool (Microsoft Clarity or Hotjar), and eventually a testing tool when your traffic supports it. Don’t build a 10-tool stack on day one. Craig Sullivan, who’s worked with Google and Amazon on CRO, puts it well: “It’s mainly about mindset of the team, not the tools.” For staying sharp on strategy, the top CRO blogs for practitioners are worth bookmarking.
Can I do CRO without tools?
You can start. Review your analytics. Talk to customers. Make changes based on common sense and proven CRO principles. But tools let you validate with data instead of guessing. Microsoft Clarity takes 10 minutes to install and immediately shows you what visitors actually do. No reason not to.
What happened to Google Optimize?
Google shut it down in September 2023. It was the only free, simple A/B testing tool for small businesses. The shutdown left a gap. VWO and other tools reduced pricing to capture those teams, but nothing has fully replaced the simplicity of Google Optimize yet. Our roundup of Google Optimize alternatives covers the closest options, including Kirro at EUR 99/month.
Best CRO tools for ecommerce: 12 picks that actually move revenue
The best CRO tools for ecommerce depend on your store's traffic, budget, and where you're losing sales. For most small-to-mid Shopify stores, [Kirro](https://ki ...
Randy Wattilete Best session replay tools in 2026: 8 tools compared honestly
7 best Hotjar alternatives in 2026 (and why people are switching)
CRO software: what it is, what to buy, and what actually matters
Competitor Comparisons
The A/B testing market just got a lot smaller. VWO and AB Tasty merged in January 2026, creating a $100M+ revenue company backed by private equity. Optimizely keeps moving upmarket. The tools are consolidating into bigger, pricier bundles.
And the gap for small teams keeps getting wider.
High pricing already restricts about 35% of potential market growth among small and mid-size businesses. If that describes you, the comparisons below cut through the noise. No feature spreadsheets. Just: here’s what each tool costs, who it’s built for, and whether it fits your situation.
How to pick the right comparison
Every post in this cluster covers a different buying scenario. Here’s which one to read based on where you are right now.
Comparing the two biggest names? Our VWO vs Optimizely comparison uses real G2 data, pricing breakdowns, and 796 verified TrustRadius reviews. VWO wins on ease of use and price. Optimizely wins on enterprise features. For teams under 10 people, the honest answer is: both are overkill.
Leaving Optimizely? The best Optimizely alternatives guide covers seven replacements, organized by why you’re switching. Price, complexity, privacy, open source. Each reason points to a different tool. Updated for the VWO/AB Tasty merger.
Lost Google Optimize? When Google shut down Optimize in September 2023, 500,000+ websites lost their testing tool. Our Google Optimize alternatives guide ranks 10 replacements with real pricing and honest drawbacks.
Need to know what Optimizely actually costs? Optimizely pricing breaks down the real numbers. Spoiler: it starts at $36,000/year, and total cost runs 35-50% above the license fee. None of this is on their website.
Evaluating Convert? Our Convert A/B testing review covers the privacy-focused mid-market option. Strong on data compliance and support. Starts at $299/month. But the visual editor and a HIPAA gap are worth knowing about before you commit.
The market right now
Here’s how the A/B testing tool market breaks down in 2026:
| Tier | Tools | Starting price | Built for |
|---|---|---|---|
| Enterprise | Optimizely, Adobe Target | $36,000+/year | 50+ person teams, dedicated CRO specialists |
| Mid-market (post-merger) | VWO/AB Tasty, Convert | $299-599/month | Agencies, mid-size companies, privacy-focused teams |
| SMB | Kirro, Mida, Zoho PageSense | EUR 99-299/month | Marketers, founders, small teams |
| Developer/open-source | GrowthBook, Statsig | Free-$150/month | Engineering-led product teams |
The mid-market is where the most change happened. VWO and AB Tasty combining means fewer choices at the $300-500/month price point. And PE-backed consolidation usually pushes prices up, not down.
If you’re a small team or solo marketer, the parent A/B Testing pillar page covers the full picture, from methodology to tools to strategy.
Our take: The tool matters less than actually using it. CXL analyzed 28,304 experiments and found that the companies producing results weren’t the ones with the fanciest tools. They were the ones running tests consistently. Only 1 in 8 A/B tests creates a significant lift. That means you need volume. A EUR 99/month tool used weekly beats a $36,000/year tool used quarterly.
Ready to stop comparing and start testing? Kirro’s free trial gives you 30 days with the full product. No credit card. No feature limits. Three minutes to set up.
Adobe Target A/B testing: what it is, what it costs, and whether you need it
Adobe Target is Adobe's enterprise A/B testing and personalization platform. It's powerful, deeply integrated with the Adobe ecosystem, and priced like it. If y ...
Randy Wattilete 7 best Crazy Egg alternatives in 2026 (honest comparison)
8 best FullStory alternatives in 2026 (honest picks by use case)
Hotjar pricing in 2026: plans, real costs, and what changed
Platform-Specific Testing
A/B testing on your own website is straightforward. You control the traffic split, the test duration, and what “winning” means. Platform testing is different. Amazon, Meta, Google Ads, and Webflow each have built-in testing features, but they all play by their own rules.
The biggest difference most guides skip: on ad platforms, the algorithm decides who sees what. A 2025 study published in the Journal of Marketing found that platform algorithms create “divergent delivery,” where different ads get shown to different types of people. Your “winning” ad might only look better because the algorithm showed it to more receptive users, not because the creative itself was stronger.
That’s a problem if you’re trying to learn what actually works.
What you can (and can’t) test on each platform
| Platform | What you can test | What you can’t test | Big limitation |
|---|---|---|---|
| Amazon | Titles, images, bullet points, A+ Content | Pricing, layout, storefront structure | Requires Brand Registry + undisclosed traffic minimum |
| Meta | Ad creative, audiences, placements | Landing page experience, post-click behavior | Algorithm redistributes budget mid-test |
| Google Ads | Ad copy, bidding strategies, asset groups | Cross-campaign comparisons, landing pages | One asset group at a time (10 groups = 40-60 weeks) |
| Webflow | Any page element via Webflow Optimize or third-party tools | Backend logic, pricing, checkout flows | Webflow Optimize starts at $299/month |
Our take: Every platform tests the ad or the listing. None of them test what happens after someone clicks. That’s where most conversions are won or lost. A dedicated tool like Kirro fills that gap: you test your actual landing page, checkout flow, or homepage with a clean 50/50 traffic split that you control.
Pick the right guide for your situation
If you sell on Amazon and want to test product listings, our Amazon A/B testing guide walks through Manage Your Experiments step by step, including the eligibility requirements Amazon doesn’t make obvious and the third-party alternatives when their tool falls short.
Running Facebook or Instagram ads? The Meta A/B testing guide covers how their Experiments tool changed in 2025, when to use it vs. testing landing pages externally, and how to avoid the algorithm interfering with your results.
For Google Ads, the Google Ads A/B testing guide explains campaign experiments, the new Performance Max asset testing beta, and the math behind why PMax testing takes so long.
If your site runs on Webflow, Webflow A/B testing compares your options: Webflow Optimize ($299/month), Optibase (from $19/month), and external tools like Kirro that work with any site, Webflow included.
The handoff problem
Here’s the thing nobody in the ad platform world talks about: the ad got someone to click. Great. Now what?
If the landing page doesn’t convert, the best ad creative in the world doesn’t matter. Platform tests stop at the click. Your website is where the actual conversion happens, and that’s where you need a separate testing tool.
Think of it as a relay race. The ad platform runs the first leg. Your landing page runs the second. Most teams only time the first runner.
All of these guides live under the A/B Testing & Experimentation pillar, alongside our tools and methodology deep dives.
Google Ads A/B testing: test your ads and landing pages
Google Ads A/B testing works on two levels. The first is ad-level testing (headlines, descriptions, bid strategies) which Google handles natively through a feat ...
Randy Wattilete Webflow A/B testing: how to run split tests on your Webflow site
Amazon A/B testing: how to split test listings (and what Amazon won't tell you)
Meta A/B testing: how to run Facebook and Instagram ad tests that actually work
SEO A/B Testing
Most testing guides treat SEO A/B testing and regular A/B testing as the same thing. They’re not. The difference changes everything: which tools you need, how long tests take, how many pages you need, and whether your site even qualifies.
Regular A/B testing (the kind Kirro does) shows half your visitors one version of a page and the other half a different version. Same URL, two experiences. You’re testing how people behave.
SEO testing can’t work that way. Google is one crawler. You can’t show it two versions of the same URL. So instead, you group similar pages (say, 200 product pages), change half of them, and compare organic traffic between the two groups over weeks. You’re testing how the search engine behaves.
That distinction is why SEO testing is its own discipline. It needs different tools, larger sites, and more patience. For a full breakdown of how it works, read our SEO A/B testing guide. It covers the methodology, the tools, the real failure rates (75% of tests are inconclusive), and what smaller sites can do instead.
Who is SEO testing for, and who is it not for?
SEO split testing is built for publishers, large e-commerce sites, and marketplaces with hundreds or thousands of pages on the same template. Etsy, Pinterest, and Booking.com run it because they have the page volume to produce reliable results.
Most small and mid-size sites don’t have that volume. And that’s fine. If your site has fewer than 100 similar pages, the math doesn’t work for a proper split test. The noise in your traffic data drowns out any real signal.
The better move? Test what happens after visitors arrive. Regular A/B testing on your landing pages, headlines, and calls to action works at any traffic level. Try Kirro free and test your highest-traffic page today. That’s where the fastest wins are for most businesses.
Where should you start reading?
Our complete SEO A/B testing guide covers the full picture: how the methodology works step by step, what you can actually test (title tags, headings, structured data, internal links), why most tests show no clear result, and the honest alternatives for sites that don’t have enterprise-scale traffic. It also breaks down every major SEO testing tool and when each one makes sense.
If you’re new to testing in general, start with the A/B testing pillar page for the fundamentals. Want to understand how A/B testing affects conversion rates? That guide covers what to expect by industry. And if the term “split testing” is new, our split testing explainer starts from zero.
The bottom line: SEO testing is powerful for sites with the right setup. For everyone else, regular A/B testing delivers faster, cheaper results with way less complexity.
Testing Methodology
Only 1 in 7 A/B tests reach statistical significance. That’s an 86% failure rate. And yet 58% of companies have no framework for deciding what or how to test.
Those two stats are connected. Bad methodology is why most tests fail. Not bad ideas.
This section covers the science behind reliable testing. Every method below has a specific use case. Some need thousands of visitors. Some work with a few hundred. Some give you fast answers. Others give you precise ones. The trick is matching the method to your situation.
Kirro uses Bayesian statistics and handles the math for you. You get answers like “Version B has an 89% chance of being better,” not p-values.
This cluster is part of the A/B Testing & Experimentation pillar.
Which method do I need?
Start here. Don’t read all 18 articles. Answer these three questions, then go to the one that matches.
Question 1: How much traffic does your page get?
- Under 1,000 visitors/month: Focus on big, obvious changes. Test one thing at a time. Read split testing meaning for the basics, then jump to landing page split testing for a step-by-step playbook.
- 1,000 to 10,000 visitors/month: Standard A/B testing works. You can detect meaningful differences with enough patience. Start with how to design a marketing experiment and use our sample size calculator to check timing.
- 10,000+ visitors/month: You have options. A/B tests, multivariate testing, even multi-armed bandits. Read on.
Question 2: What’s your goal?
- “I need to learn which version is better.” Classic A/B test. You want precision and confidence. This is what most teams need most of the time.
- “I need to optimize revenue right now.” Multi-armed bandits send more traffic to the winning version while the test runs. Less learning, more earning. Good for short campaigns and sales events.
- “I need to test several elements at once.” Multivariate testing lets you test headlines, images, and buttons simultaneously. But you’ll need serious traffic (think 50,000+ visitors) to get reliable results.
Question 3: How comfortable are you with statistics?
- “Not at all.” That’s fine. Bayesian A/B testing gives you probabilities in plain language. Kirro shows “89% chance Version B wins” instead of confusing p-values. Start there.
- “I know the basics.” Dig into the sample size formula and A/B testing conversion rate benchmarks to set realistic expectations.
- “I want the deep stats.” Go for type 1 vs type 2 errors, power analysis, null hypothesis testing, and minimum detectable effect.
Our take: A December 2025 Harvard Business Review study found that traditional significance testing demands 24 to 55 times more data than you actually need for a good business decision. Speed often matters more than certainty. Most small teams are better off running more tests with slightly less precision than running fewer “perfect” tests.
The core methods
Standard A/B testing splits traffic 50/50 between your current page and one change. It’s the workhorse. Reliable, easy to understand, works at almost any traffic level. If you’re new to testing, split testing meaning explains the concept, and landing page split testing walks through a real example. For the stats behind it, see A/B testing conversion rate.
Bayesian A/B testing updates results as visitors arrive instead of making you wait for a fixed sample. Kirro uses this approach because the results make sense to non-statisticians. “89% chance Version B wins” is a sentence your boss can act on. Our Bayesian A/B testing guide covers when it helps and when it’s overkill.
Multivariate testing tests combinations of changes. Different headlines paired with different images paired with different buttons. Powerful, but hungry for traffic. Our multivariate testing guide includes the traffic calculator so you can check if your site qualifies before committing.
Multi-armed bandits automatically shift traffic toward whichever version is winning. Less learning, faster revenue. Good for flash sales or time-limited campaigns where waiting for full statistical confidence would cost you money. Deep dive: multi-armed bandit testing.
Sequential testing lets you stop a test early (or keep it running longer) based on ongoing results, without inflating your false positive rate. It solves the “peeking problem” that Evan Miller famously showed raises error rates from 5% to 26%. Full guide: sequential testing.
CUPED (variance reduction) uses data you already have about your visitors to reduce the noise in your results. The practical result: 30 to 40% smaller sample sizes for the same precision. If your tests always seem to take too long, this is probably the fix. Guide: CUPED and variance reduction.
The statistics that actually matter
Every testing method above relies on the same handful of statistical concepts. You don’t need to calculate them (that’s the tool’s job). But knowing what they mean helps you avoid the most common A/B testing mistakes.
Sample size is “how many visitors do I need?” Too few and your test can’t tell a real winner from random noise. Our sample size formula guide breaks down the math, and the free calculator does it for you.
Minimum detectable effect is “what’s the smallest improvement worth finding?” If you’d only act on a 20% improvement, don’t set up a test designed to detect 2% changes. It’ll take forever. MDE guide.
Type 1 and type 2 errors are the two ways a test can lie to you. A type 1 error says B wins when it doesn’t (false alarm). A type 2 error misses a real winner (missed opportunity). Understanding both helps you set up tests that balance speed with accuracy.
Statistical power is the probability your test will actually detect a real difference. Low power means you’ll miss winners. Microsoft runs 10,000+ experiments annually and still obsesses over power calculations. If it matters to them at that scale, it matters to you. Power analysis guide.
For the full theoretical foundation (what a null hypothesis is, how to think about probability): null hypothesis in A/B testing.
Implementation and architecture
Picking the right statistical method gets you halfway. The other half is the practical setup: where the test runs, how visitors get assigned to versions, and what happens when cookies disappear.
Experiment design covers the full process: forming a clear guess about what will happen, choosing the right metric, picking the page, and setting up controls. How to design a marketing experiment walks through this start to finish.
Client-side vs server-side testing is about where the test runs. Client-side (in the browser) is easier to set up but can cause page flicker. Server-side (on your server) is invisible to visitors but needs developer involvement. Most small teams start client-side and it works fine. Client-side vs server-side A/B testing helps you decide.
Cookieless testing matters more every year. Safari already blocks third-party cookies. Chrome offers users a choice. If your testing tool relies on third-party cookies, you’re losing data on a growing chunk of visitors. Cookieless A/B testing covers the alternatives.
Feature flags vs A/B testing confuses a lot of teams. Feature flags let developers turn features on and off. A/B tests measure which version performs better. They solve different problems, and some platforms bundle them together. If you’re wondering whether you need a feature flag tool or a testing tool, feature flags vs A/B testing sorts it out. (Short answer for most marketers: you need a testing tool.)
AI-powered testing is the newest addition to the toolkit. AI can help prioritize what to test, generate variations, and analyze results faster. But it’s not magic, and the fundamentals still apply. AI A/B testing separates the real applications from the hype.
Start somewhere
Most teams overthink the methodology and underthink the action. Microsoft found that a 1% improvement to Bing’s revenue equals over $10 million per year. Those gains came from running thousands of simple tests, not from picking the “perfect” statistical method.
Pick a high-traffic page. Change one thing. Run the test. Three minutes to set up in Kirro. The methodology guides above are here for when you want to go deeper. But the first test? Just run it.
A/B testing template: 5 ready-to-use templates for every stage of your test
You need an A/B testing template. Not a 30-page whitepaper about experimentation culture. Just a simple document that keeps your test organized from start to fi ...
Randy Wattilete