Power analysis answers a simple question: do I have enough visitors to trust my A/B test results? It tells you how many visitors each version needs and how long to run the test. All before you start. Skip it and you’ll waste weeks on a test that was never going to give you a clear answer.
Most power analysis guides read like a statistics textbook. This one won’t. It’s a core part of A/B testing and solid testing methodology. What statistical power actually means, why skipping it costs you money, and how to do it in five minutes. No PhD required.
What is statistical power (and why should you care)?
Say you redesign your pricing page and the new version actually converts 15% better. Statistical power is the probability your A/B test will detect that improvement.
The standard is 80% power. That comes from Jacob Cohen, a statistician who set the convention back in 1988. At 80% power, your test has a 4-in-5 chance of catching a real difference. The flip side: 1 in 5 real winners will slip through. Your test will say “no clear winner” even though one version was genuinely better.
Think of it like fishing with a net. Power is how fine your mesh is. A test with high power has a tight net. It catches real improvements. A test with low power has holes in it. Real winners swim right through and you never know they were there.
Power connects directly to Type 1 and Type 2 errors in A/B testing. A Type 2 error is when your test misses a real winner. Power is your protection against that. Higher power means fewer missed wins.
Our take: 80% power means accepting that 1 in 5 real improvements will go undetected. Most marketing teams don’t realize they’re signing up for those odds. And honestly, most are running tests with far worse odds than that.
What happens when your test is underpowered
This is where it gets expensive. An underpowered test (one without enough visitors) fails in two ways. Both cost you money.
Failure mode 1: you miss a real winner. You ran a test for three weeks. The results come back “inconclusive.” You shrug, move on, and never ship the change.
But the new version was actually better. You just didn’t have enough visitors to prove it. That’s weeks of work wasted, plus the revenue you keep losing by not shipping the better version.
Failure mode 2: you crown a fake winner. This one’s sneakier. Underpowered tests that do find “winners” tend to massively overestimate the effect. Researchers call this the Winner’s Curse.
A 2013 study in Nature Reviews Neuroscience found that underpowered studies inflated their detected effects by 2x to 4x. You think your new headline boosts conversions by 30%. In reality, the boost is 5%. Or zero.
Statisticians Andrew Gelman and John Carlin described two specific ways underpowered tests go wrong in a 2014 paper. Type S means getting the direction wrong, so your “winner” actually performs worse. Type M means getting the size wrong, so a tiny improvement looks huge. Both are far more common when power is low.
An analysis of 115 real A/B tests by Georgi Georgiev at Analytics-Toolkit found that most lacked adequate statistical power. The average observed lift was about 4%. That’s small.
Detecting a 4% lift needs a lot of visitors. Most teams don’t plan for that.
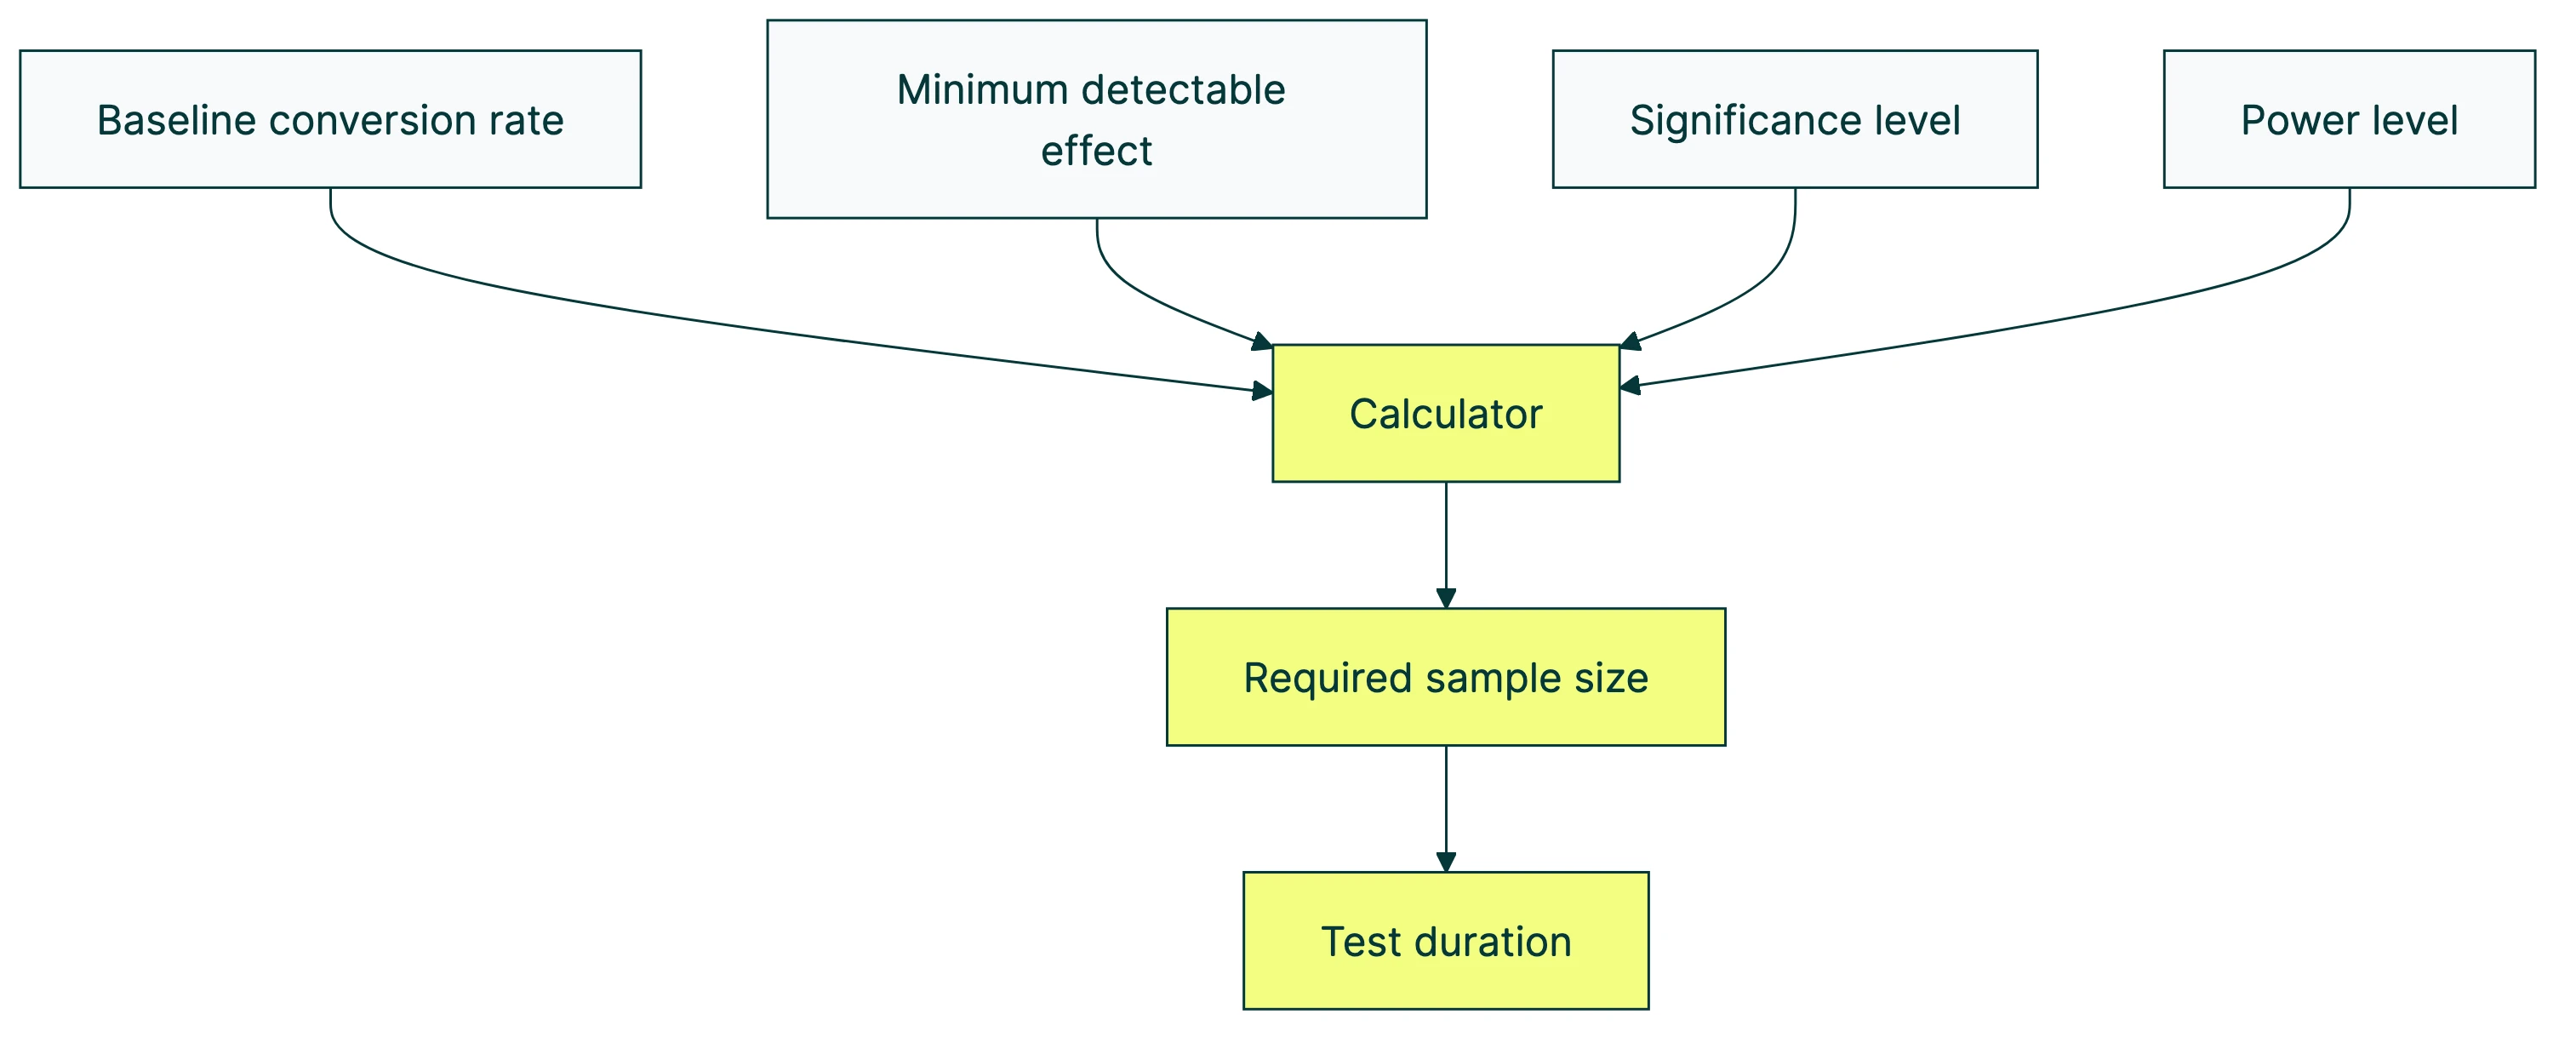
The four inputs to a power analysis calculator
Power analysis is a recipe with four ingredients. Change any one and the output (how many visitors you need) changes too.
1. Your baseline conversion rate. What your page does right now. If 3 out of every 100 visitors buy, your baseline is 3%. Pull it from GA4 or whatever analytics tool you use. Our guide on measuring A/B testing conversion rates walks through it if you’re not sure.
2. The smallest improvement worth catching. This is called the minimum detectable effect (MDE). It’s the smallest lift that would actually matter to your business. If your conversion rate is 3%, a 10% relative lift means going from 3.0% to 3.3%. Is that worth four weeks of testing? Maybe. Maybe not. A smaller MDE means you need more visitors.
3. Your false-positive tolerance (significance level). How much risk will you accept that the test declares a winner when there isn’t one? The standard is 5% (statisticians call it alpha). Stick with 5% unless you have a specific reason to change it. For more on false positives, see our post on Type 1 and Type 2 errors.
4. Your desired power level. This is the number we’ve been talking about. 80% is standard. 90% if the stakes are high. We’ll cover when to use which in a later section.
See how they interact:
| If you want to… | You’ll need… |
|---|---|
| Detect smaller improvements | More visitors |
| Increase power from 80% to 90% | About 30% more visitors |
| Tighten significance from 5% to 1% | More visitors |
| Test a page with lower baseline conversion | More visitors |
The pattern is clear. More certainty always costs more visitors, which means more time.
How to run a power analysis for your A/B test (step by step)
Five minutes. That’s all it takes.
Step 1: Find your baseline conversion rate. Open your analytics. Look at the page you want to test. How many visitors did it get last month? How many converted? Divide conversions by visitors. That’s your baseline — the performance of your control group sizing starts here.
Step 2: Decide your minimum detectable effect. This is a business question, not a math question. If going from 3.0% to 3.15% conversion wouldn’t get you excited, you need a bigger target. Think about what lift would actually change your revenue enough to justify the test.
Step 3: Choose your significance level. Use 5%. Seriously, just use 5%. Unless you’re in a regulated industry or testing something irreversible, the standard works fine.
Step 4: Choose your power level. Use 80% for most tests. Use 90% for high-stakes changes like pricing or checkout redesigns. We’ll explain why in the next section.
Step 5: Plug it into a calculator. Use our sample size calculator or the power calculator to check your test’s power level. Enter your four numbers. The output is how many visitors you need per version.
Step 6: Divide by daily traffic to get your test duration. Calculator says 3,500 visitors per version. Your page gets 500 visitors per day. That’s 7 days per version. Since both versions run at the same time, you need 7 days total (assuming a 50/50 split).
Worked example: Your pricing page gets 500 visitors per day at 4% conversion. You want to detect a 15% relative lift (4.0% → 4.6%). At 80% power and 5% significance, the sample size formula tells you: roughly 3,500 visitors per version. That’s 14 days.
If 14 days sounds reasonable, run the test. If the calculator says you need 90 days, the test probably isn’t worth it at that MDE. Either find a way to send more traffic or aim for a bigger change.
Kirro does this math for you automatically. It looks at your traffic and conversion rate, then tells you how long your test needs to run. No calculator needed. If you don’t have enough traffic, it tells you that honestly instead of letting you run a doomed test.
Why most A/B tests are underpowered (and the hidden cost)
This isn’t just a marketing problem. Science has the same issue. And it’s been ugly.
In 1962, Jacob Cohen reviewed published psychology studies and found the median statistical power was 0.48. Basically a coin flip.
Decades later, a 2013 study by Button et al. found that neuroscience was even worse, with median power around 21%. That means roughly 4 out of 5 neuroscience studies couldn’t reliably detect the effects they were looking for.
The fallout was real. John Ioannidis published what became the most-cited paper in meta-science in 2005, arguing that most published research findings are false. Low statistical power was one of the key reasons.
In 2015, the Open Science Collaboration tried to replicate 100 psychology studies. Only 36% replicated. Underpowered designs were a major contributor.
Now think about A/B testing. Peer-reviewed research, run by trained statisticians with careers on the line, gets power wrong. What chance does a marketing team have without power analysis?
The parallel is direct. Ron Kohavi and colleagues wrote in the Harvard Business Review that even at Microsoft, most tested ideas don’t win. World-class data scientists, huge sample sizes, and still most tests come back flat.
Running tests without planning for power doesn’t just waste time. It produces false knowledge. You end up “knowing” things that aren’t true.
Georgi Georgiev’s extended analysis of over 1,000 A/B tests confirms the pattern in practice. Most common A/B testing mistakes trace back to insufficient planning, and skipping power analysis is near the top of the list.
Our take: If a full-time scientist with a statistics PhD runs underpowered studies, there’s no shame in a marketing team getting it wrong too. But there’s no excuse for not spending five minutes on a power analysis calculator first.
Statistical power vs statistical significance
This is the single biggest point of confusion in A/B testing statistics. And three of the five top-ranking articles on Google get it wrong (or at least muddy it). So let’s be precise.
Statistical power is a question you ask before the test. “If my new design really is 15% better, will my test be able to catch that?” It’s about planning.
Statistical significance is a question you ask after the test. “The data says Version B is better. Could that just be random noise?” It’s about interpreting results.
Think of it this way. Power is whether your camera was even turned on. Significance is whether your camera caught something on film. You need the camera on (power) to have any chance of capturing the shot (significance).
| Statistical power | Statistical significance | |
|---|---|---|
| When | Before the test | After the test |
| Question | ”Can my test detect a real difference?" | "Is this result real or random?” |
| Controls | False negatives (missed winners) | False positives (fake winners) |
| Standard | 80% | 95% (alpha = 5%) |
| You set it by | Planning sample size | Choosing significance threshold |
A common mistake: thinking “my test cleared the 5% significance bar (you can compute a p-value to check), so it must be high power.” Nope. A test can reach significance with low power if the true effect is large. And a high-power test won’t reach significance if the effect doesn’t exist. They’re independent concepts.
This matters because confusing the two leads to bad decisions. A “significant” result from an underpowered test is far more likely to be inflated or wrong. Simmons et al. (2011) showed that flexible analysis combined with low power can produce “significant” results from pure noise.
When to use 80% vs 90% power (and when it doesn’t matter)
The 80% convention is exactly that. A convention. Jacob Cohen picked it as a reasonable balance between catching real effects and not requiring impossibly large samples. It works for most A/B tests.
But think about what 80% power actually means. You’re accepting a 20% chance of missing a real improvement. For a headline test on your blog? That’s fine. For a checkout flow redesign that took your developer two weeks to build? Maybe not.
When 80% is enough:
- Routine split tests on headlines, images, or button copy
- Tests you can easily re-run if results are unclear
- Landing page split testing where you have a steady stream of ideas
When 90% makes more sense:
- Pricing page changes (hard to re-test without confusing returning visitors)
- Checkout flow redesigns (expensive to build and test again)
- Any test where a false negative has real strategic consequences
- Multivariate testing where you need more power to detect interaction effects
Lakens et al. made the same point in their paper on justifying statistical thresholds. Match your power level to the stakes, not to convention. A weather forecast that’s right 80% of the time? Fine for packing an umbrella. Not great for launching a rocket.
There are also alternatives to traditional power analysis. The frequentist statistical methods described above aren’t the only game in town — Bayesian A/B testing approaches the problem differently. You monitor results continuously instead of committing to a fixed sample upfront. Sequential testing lets you stop a test early when the evidence is clear. Spotify uses this approach, and it cuts down the need for traditional power calculations. Techniques like CUPED variance reduction can also make your tests more sensitive without needing more visitors.
If you’d rather not think about any of this, Kirro handles power analysis automatically. Try it free. It tells you when your test has enough visitors and warns you when it doesn’t. No calculator, no formulas.
FAQ
What is power analysis in A/B testing?
Power analysis calculates how many visitors your test needs to reliably detect a real difference between two versions. You run it before starting, and it tells you how long the test needs to run at your current traffic level.
Without it, you’re guessing whether your test will produce a useful result. Like checking whether you have enough fuel before a road trip.
How do you perform a power analysis?
You need four numbers: your current conversion rate, the smallest improvement worth detecting (called MDE), your false-positive tolerance (usually 5%), and your desired power level (usually 80%). Plug these into any power analysis calculator and it gives you the number of visitors needed per version. Divide that by your daily traffic and you have your test duration.
What does a power of 80% mean?
It means your test has an 80% chance of detecting a real difference if one exists. The other 20% of the time, you’ll miss it. Your test will come back “inconclusive” even though one version genuinely performed better. Jacob Cohen proposed 80% as the standard in 1988, and it’s still the default for most A/B testing software and calculators.
How much traffic do I need for an A/B test?
It depends on your conversion rate and how small a change you want to detect. A site with a 3% conversion rate needs roughly 3,500 visitors per version to detect a 15% relative lift at 80% power. Lower conversion rates or smaller effects need more traffic. Pages with very low traffic (under 1,000 visitors per week) will struggle with standard A/B testing. In those cases, consider CRO testing approaches that don’t require as large a sample.
What happens if I skip power analysis and just run the test?
You risk two bad outcomes. Your test might run for weeks and come back “inconclusive” because you didn’t have enough visitors. Weeks wasted.
Or you might get a false winner, ship it to everyone, and wonder why conversions didn’t improve (or got worse). Power analysis takes five minutes and prevents both. The cost of skipping it is measured in weeks and revenue.
This also connects to what the null hypothesis means for your test. Understanding what your test is actually measuring helps you plan it properly.

Randy Wattilete
CRO expert and founder with nearly a decade running conversion experiments for companies from early-stage startups to global brands. Built programs for Nestlé, felyx, and Storytel. Founder of Kirro (A/B testing).
View all author posts