Bayesian A/B testing measures which version of a page works better using a probability that updates as data comes in. Instead of waiting for some magic number of visitors, you get a running answer: “Version B has an 89% chance of getting more signups.”
That’s it. No statistics degree required.
People like it for the same reason weather forecasts work. You start with what you know (“it usually rains 30% of the time in April”), then update as new info arrives. After enough data, the forecast gets accurate regardless of where you started.
Below: how Bayesian testing methodology works in plain language, when it genuinely helps, and when it’s a waste of your time. (Want to see both approaches side by side? Our significance calculator shows frequentist and Bayesian results together.) Plus what happens when your starting assumptions are wrong, and the one metric that actually helps you make decisions. (For the fundamentals, see our complete guide to A/B testing.)
What is Bayesian A/B testing?
Traditional A/B testing works like a pass/fail exam. Most tools use this approach by default (it’s called frequentist testing — see our frequentist vs Bayesian comparison for the full breakdown). You run the test, wait until you have enough visitors, and it tells you: “statistically significant” or “not significant.” The whole process revolves around the null hypothesis in traditional testing. That’s it. No context about how much better one version is. And if you don’t fully understand type 1 and type 2 errors, those results can mislead you.
Bayesian A/B testing flips this. Instead of pass/fail, it gives you a probability. “There’s an 89% chance Version B gets more signups.” That’s a sentence your boss can actually understand.
The funny part? Research from CXL shows 80%+ of people already misread traditional results as probabilities. They see a significant result and think “there’s a 95% chance this works.” That’s not what it means. But it’s how everyone reads it. Bayesian testing just gives you the number people already wanted.
Kirro uses Bayesian statistics for exactly this reason. Results show up as plain probabilities: “Version B has an 89% chance of getting more signups.” Measure your conversion rate, run the test, get an answer you can act on.
Our take: The stats debate between Bayesian and frequentist is mostly an academic argument. For small businesses, what matters is: can you understand the results? Bayesian gives you a percentage. Frequentist gives you a p-value (you can get one from our free p-value calculator). We’ve never met a marketer who preferred the p-value.
How Bayesian A/B testing works (without the math)
The whole thing works in three steps. No formulas. Promise.
Step 1: Start with what you already know. Your landing page converts at about 3%. That’s your starting point (statisticians call this the “prior”). You’re telling the math: “here’s what I know about my page before the test even starts.”
Step 2: Run your test. Visitors see Version A or Version B. Data comes in. Nothing unusual here, this is the same as any split test.
Step 3: Update your belief. As data arrives, the math combines what you already knew (3% conversion rate) with the new evidence. Your estimate gets sharper. More data, clearer picture.
Think of it like a blurry photo that gets crisper with each new visitor. After 50 visitors, you have a rough idea. After 500, you’ve got a pretty clear picture. After 5,000, it’s sharp.
The whole process produces three numbers that matter:
- Probability of being better (called “probability to be best”): “92% chance Version B wins.” This is the headline number.
- How much you’d lose if you’re wrong (called “expected loss”): “If B isn’t actually better, you’d lose about 0.3% conversion rate.” We’ll come back to this one because it’s the most underrated metric in testing.
- The range where the real answer probably sits (called a “credible interval”): “The true improvement is probably between 0.5% and 4.2%.”
Think of it as a confidence meter that fills up gradually, instead of a pass/fail exam you have to wait weeks to take.
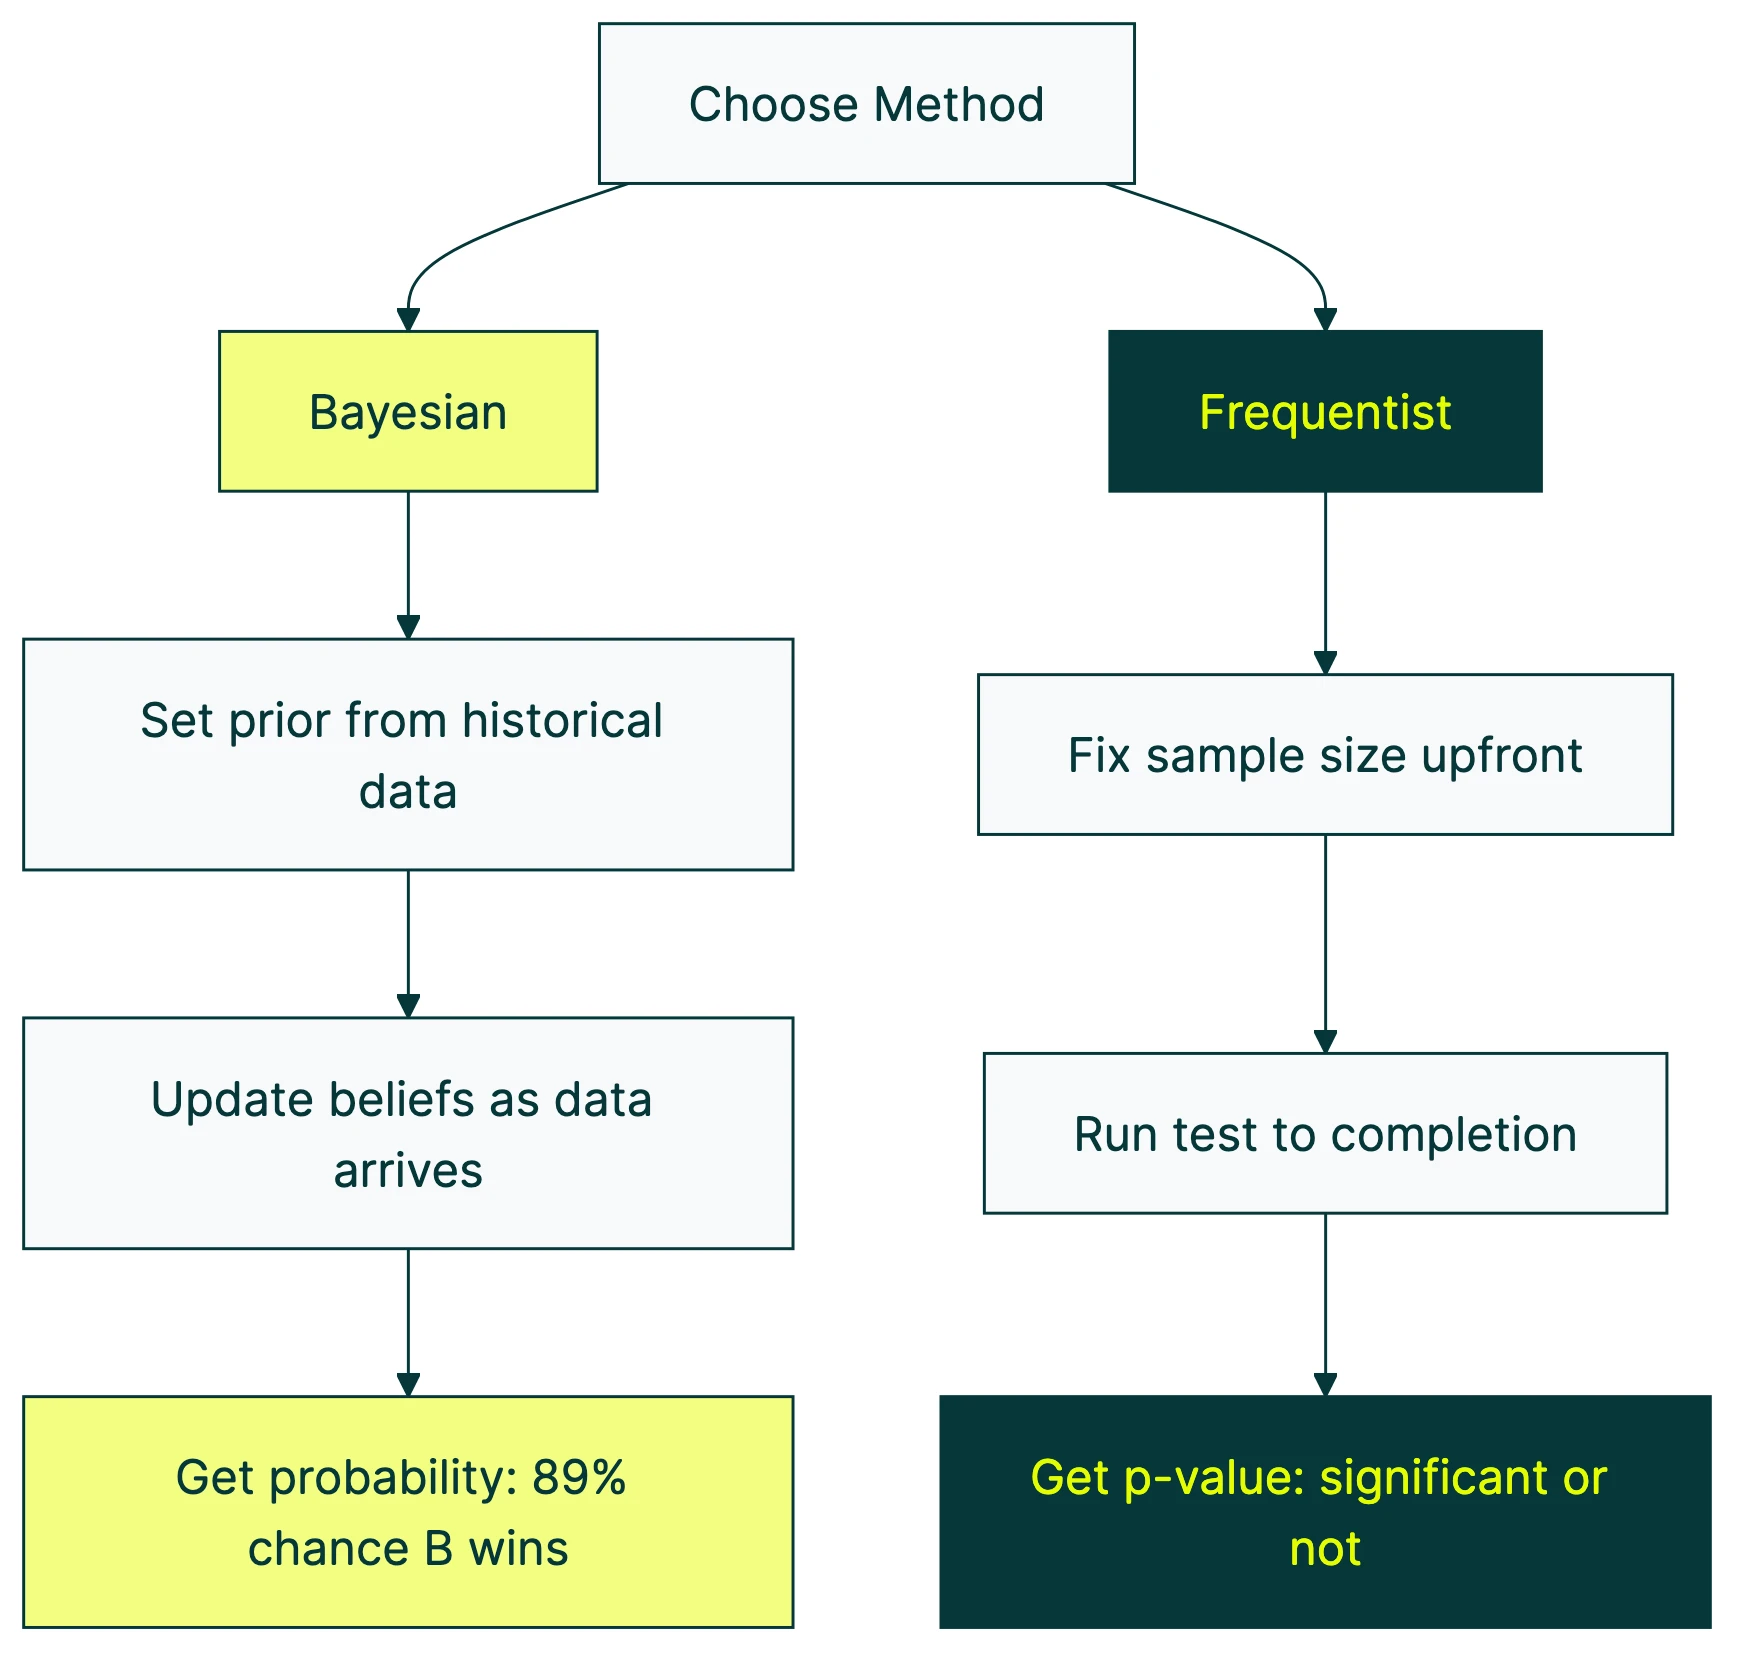
Bayesian vs. frequentist testing: which should you use?
This is the question everyone asks. Here’s a side-by-side:
| Bayesian | Frequentist | |
|---|---|---|
| What it tells you | ”89% chance B is better" | "This result is unlikely to be random noise” |
| Can you check results early? | Yes, the probability updates continuously (with caveats) | Checking early creates fake winners |
| Number of visitors needed | Can be lower with good historical data | Requires a pre-set number of visitors (via power analysis in frequentist testing) |
| Results language | ”89% chance B wins" | "p < 0.05” |
| What you need to choose upfront | A starting assumption (the prior) | A significance level (usually 5%) |
The honest answer? For most small businesses, the method matters less than actually running tests. Both approaches give similar answers with enough data. Mathematicians proved this ages ago. With enough visitors, the two methods agree. Period.
Choosing between Bayesian and frequentist is like choosing between iPhone and Android. Both make calls. Pick the one your tool supports and focus on running split tests and following testing best practices, not debating statistics.
That said, there are real differences. They matter in specific situations. Keep reading.
The peeking problem: why checking results early can trick you
Traditional A/B tests assume you only look at results once, at the end. But everyone peeks. You launch a test on Monday, and by Tuesday afternoon you’re already checking if Version B is winning.
The problem? Peeking breaks the math.
A study from the University of British Columbia put real numbers on this. When you check a traditional test every day, your chance of picking a fake winner jumps from 5% to 23.4%. In tests where there was zero real difference, 77% still showed a “confident” result. After 100,000 visitors with continuous peeking, 60% of simulations crowned a winner that wasn’t.
That’s roughly 1 in 4 “winning” results being wrong. One of the most common A/B testing mistakes. And one of the most expensive.
Bayesian testing handles this better. The probability updates with every visitor, so looking at results doesn’t break the math. The number is valid at any point. That’s a real advantage.
Bayesian testing is NOT immune to peeking, though. David Robinson, the former lead data scientist at Stack Overflow, ran simulations proving this. When you stop a Bayesian test the moment results look good, fake winners jumped from 2.5% to 11.8%. That’s a 4.7x increase.
His conclusion: “The claim that Bayesian testing is unaffected by early stopping is simply too strong.”
Even VWO’s own data scientist, Chris Stucchio, acknowledged this in the SmartStats whitepaper. Stopping whenever you feel like it creates more fake winners. That’s why VWO builds proper stopping rules into the tool.
Bayesian testing gives you better brakes. You still need to drive carefully. Before starting any test, set a minimum number of visitors AND a risk threshold. Don’t stop the moment results look positive. For a deeper look at methods designed specifically for safe peeking, see our guide to sequential testing methods.
Our take: Every tool that says “peek whenever you want with zero consequences” is overselling. Bayesian testing genuinely reduces the peeking penalty. It doesn’t eliminate it. Set your minimum number of visitors before the test starts and stick to it. Your future self will thank you.
When Bayesian testing actually helps (and when it’s overkill)
Bayesian testing isn’t always the right call. Here’s a practical framework.
When Bayesian is the right choice:
If your site gets 1,000 to 10,000 visitors per month and you have historical conversion data, Bayesian testing shines. You can also pair it with CUPED to reduce noise and reach conclusions even faster. A simulation study from Towards Data Science showed 75% of tests concluded within 22.7% of the visitors a traditional test would need. That’s a big deal when every visitor counts.
It’s also worth it when your team needs plain-language results. “92% chance Version B is better” is easier to act on than “p = 0.04.” No translator needed. And if cookie consent is reducing your testable audience, Bayesian methods are especially useful for testing with smaller consent-based samples.
And if you’ve been testing your landing pages for a while, that history becomes your starting assumption. It gives the test a head start.
When Bayesian is overkill:
High-traffic sites (100K+ visitors per month) don’t need it. Both methods agree at that scale. Google, Microsoft, and Netflix all use traditional testing as their backbone. At that volume, multivariate testing, multi-armed bandit testing, or other CRO test types might be a better use of your time.
Regulated industries or financial decisions may need the stricter guarantees traditional testing provides. And if your team already knows the traditional approach, switching creates confusion without clear benefit. Eppo’s blog makes a good point: organizational culture matters.
One more thing. Below 50 conversions per week, skip statistical testing entirely. Focus on what CRO is about at its core: qualitative research and big, bold changes (aim for 30%+ improvements). No statistical method can rescue thin data. Not Bayesian. Not traditional. It’s just not enough information to work with.
What “choosing a prior” means (and why it’s simpler than it sounds)
This is where Bayesian testing sounds scary and really isn’t.
A “prior” is just your starting assumption. If your page converts at 3%, that’s your prior. You’re telling the math: “Before I see any test data, I believe my conversion rate is around 3%.” As the test runs, the data takes over and your starting assumption matters less and less.
Think of it like seasoning in cooking. The right amount brings out the flavor (your data reaches conclusions faster). Too much overpowers the dish (your assumptions drown out the data). Too little and you miss the benefit entirely (you get no speed advantage over traditional testing).
The “wrong prior” trap.
If your starting assumption is too strong and wrong, you actually need MORE data than traditional testing to correct it. Statsig’s research confirms this. It’s the opposite of what most articles claim.
And if you use no starting assumption at all (called a “flat prior”), things get weird. Andrew Gelman, one of the most respected statisticians alive, warns that flat priors produce “silly estimates.” They treat a 1% improvement as equally likely as a 300% improvement. With flat priors, 3%+ of tests pick fake winners after just one week.
What to do if you’re not a data scientist:
If your tool picks the prior for you (like Kirro or VWO), let it. The tool uses your historical data. That’s usually the right call.
Need to set one manually? Use your current conversion rate. Page converts at 3%? Start there.
The good news: with enough data (a few hundred conversions), the prior barely matters. The data takes over. Even if you get it slightly wrong, it corrects itself.
A quick sanity check: change your starting assumption by a little and re-check your conclusions. If the answer stays the same, you’re fine.
Expected loss: the metric that actually helps you decide
Most Bayesian testing articles explain “probability of being better” and stop there. They skip the more useful number.
Expected loss answers a different question: “If I pick Version B and I’m wrong, how much will it cost me?”
That’s a business question. Not a statistics question.
Say your test shows:
- Version B has a 92% chance of being better
- Expected loss: 0.3% conversion rate
Translation: if you go with Version B and you’re unlucky, you’d lose about 0.3 percentage points off your conversion rate. On a page with 10,000 visitors per month at 3% conversion, that’s about 3 lost conversions. Worth the gamble for the 92% upside? Almost certainly.
Compare that to traditional testing. A p-value tells you nothing about the SIZE of the loss if you’re wrong. You just get “significant” or “not significant.” Researchers at eBay found that the usual pass/fail cutoff is “too conservative” for many business decisions. A loss-based approach works better in practice.
The Convoy engineering team put it well: “Showing the risk alongside the reward is a tremendously powerful way to tell the data story.”
Practical rule: if the expected loss is smaller than the minimum improvement you care about, ship the winner. Even if the probability is 88% instead of 95%. You’re spending pennies to potentially gain dollars.
Kirro shows both numbers side by side. The probability tells you how sure you are. The expected loss tells you how much it matters. You need both to make a smart call. Try it yourself and see how they work together.
Which A/B testing tools use Bayesian statistics?
Quick reference for which approach each tool uses:
| Tool | Statistical approach | Notes |
|---|---|---|
| VWO | Bayesian (SmartStats) | Informed priors, shows probability + expected loss |
| Kirro | Bayesian | Automatic priors from your data, plain-language results |
| Dynamic Yield | Bayesian | Enterprise-focused |
| Kameleoon | Bayesian (optional) | Can switch between methods |
| Optimizely | Sequential frequentist | Developed with Stanford, handles peeking differently |
| Statsig | Both | Lets you choose your approach |
| Eppo | Both | Research-heavy team, strong on methodology |
| GrowthBook | Both | Open-source option |
| Convert | Both | Offers Bayesian and frequentist |
| Google Optimize | Was Bayesian | Shut down Sept 2023 |
For a full breakdown of features and pricing, check the A/B testing software guide or the best A/B testing tools comparison. If you’re comparing the two biggest names, there’s also a VWO vs Optimizely deep dive.
What to look for in a Bayesian tool:
Does it show BOTH probability of improvement AND expected loss? Not just one. Does it use informed priors from your data, or flat priors that give no speed benefit? And does it set proper stopping rules, or let you stop whenever you feel like it? Many modern platforms now layer machine learning on top of Bayesian engines. Our guide to AI A/B testing tools covers what these features actually do and when they’re worth it.
Watch out for tools that market “Bayesian” but use flat priors under the hood. Flat priors treat a 2% improvement as equally likely as a 200% improvement. Zero speed advantage. If your tool assumes every outcome is equally likely, the “Bayesian” label isn’t buying you anything.
You could also test this yourself with Kirro. Set up a test, let it run, watch the probability update in real time. No math degree needed.
FAQ
Is Bayesian or frequentist better for A/B testing?
Neither is universally better. Bayesian gives more intuitive results (“89% chance B wins”) and handles peeking better. Frequentist gives stricter error control. Google, Netflix, and Microsoft all use it at massive scale. For most small businesses, pick whichever your tool supports. Both methods agree with enough data. The bigger mistake is not testing at all.
How does Bayesian A/B testing work?
It starts with what you already know (your current conversion rate), then updates as test data comes in. The result is a probability: “89% chance Version B is better.” More data, more accuracy. Like a blurry photo getting sharper with every new visitor.
Can you peek at results with Bayesian A/B testing?
Yes, but with caveats. The probability updates continuously, so you can check results without breaking the math. But stopping the moment results look good still creates fake winners. Research shows the rate jumps from 2.5% to 11.8% when you stop early. Set a minimum number of visitors and a risk threshold before you start.
Does Bayesian testing require a smaller number of visitors?
It can, especially with good historical data as your starting point. One study showed 75% of tests finished with just 22.7% of the visitors a traditional test needed. But with no prior data, it needs roughly the same amount of traffic. And below 50 conversions per week, no statistical method works well. You’ll need to learn the right sample size formula either way.
How do you choose a prior for A/B testing?
Use your current conversion rate as the starting point. Page converts at 3%? That’s your prior. Most modern tools (like Kirro and VWO) handle this automatically using your historical data. With enough traffic, the prior becomes irrelevant. The data takes over.

Randy Wattilete
CRO expert and founder with nearly a decade running conversion experiments for companies from early-stage startups to global brands. Built programs for Nestlé, felyx, and Storytel. Founder of Kirro (A/B testing).
View all author posts