Sequential testing lets you check A/B testing results as data comes in. Without getting tricked by random noise. Instead of waiting for a pre-set end date, you check at planned intervals. The math accounts for the extra looking.
If the difference between versions is clearly big (or clearly zero), you stop early. If it’s unclear, you keep running.
That’s the short version. The longer version involves stopping rules, type 1 and type 2 errors, and trade-offs most articles skip. Getting your testing methodology right matters more than running more tests. Like the fact that sequential testing can actually need more visitors than a regular test. Or that stopping early makes your results look better than they really are.
We’ll cover all of it. No PhD required. (If you just want to check whether your test results are real, use the significance calculator. And the sample size calculator tells you how many visitors a fixed-horizon test needs.)
What is sequential testing?
Think of it like a doctor monitoring a patient during treatment. Instead of waiting months to check if the medicine worked, they check at set intervals. If results are clearly good (or clearly bad), they stop. If it’s still unclear, they keep going.
The idea isn’t new. Abraham Wald invented sequential analysis in 1943 to test whether bombs met quality standards. The military needed fast answers without wasting thousands of rounds. Sound familiar?
Today, every major testing platform uses some form of sequential testing. Optimizely, Netflix, Spotify, Amplitude, Kirro. The method moved from bomb factories to your homepage. The core idea stayed the same: check early, but use math that accounts for the extra checking.
The key insight is adjusted thresholds. A regular A/B test uses a fixed confidence level (usually 95%) and checks once at the end. Sequential testing uses wider thresholds early on and narrows them over time.
So peeking won’t trick you into thinking something worked when it didn’t. You keep asking “did this change actually do anything?” (that’s the null hypothesis). And the guardrails keep the math honest no matter how many times you ask.
The peeking problem: why checking results early breaks your test
Everyone peeks. You launch a test on Monday, and by Wednesday you’re refreshing the dashboard. The numbers look good.
Version B is up 12%. You screenshot it, send it to your boss, and ship the winner.
The problem? That 12% lift might be noise.
Optimizely ran simulations where both versions were identical. No difference at all. With continuous monitoring, 57% of those tests falsely declared a winner. More than half. For a test where nothing actually changed.
Evan Miller calculated that continuous peeking inflates the false positive rate to 26.1% instead of the intended 5%. That means roughly 1 in 4 “winners” you ship aren’t winners at all.
Why does this happen? Every time you check results and consider stopping, you’re essentially calculating p-values again. More tests means more chances to catch a random streak.
It’s like flipping a coin 10 times, getting 7 heads, and declaring “this coin is rigged.” Flip it 1,000 times and it’s close to 50/50. Stopping early catches random streaks, not real patterns.
And people don’t peek because they’re careless. They peek because they’re under pressure. The boss wants results. The campaign budget is running.
Amplitude reports the damage: 30 to 50% of tests give false positives with traditional testing and peeking. With sequential testing? Just 5%.
Our take: People will always peek. Always. Building a process that assumes they won’t is like building a diet plan that assumes you’ll never open the fridge. Sequential testing accepts reality and works with it.
How sequential testing works (without the math)
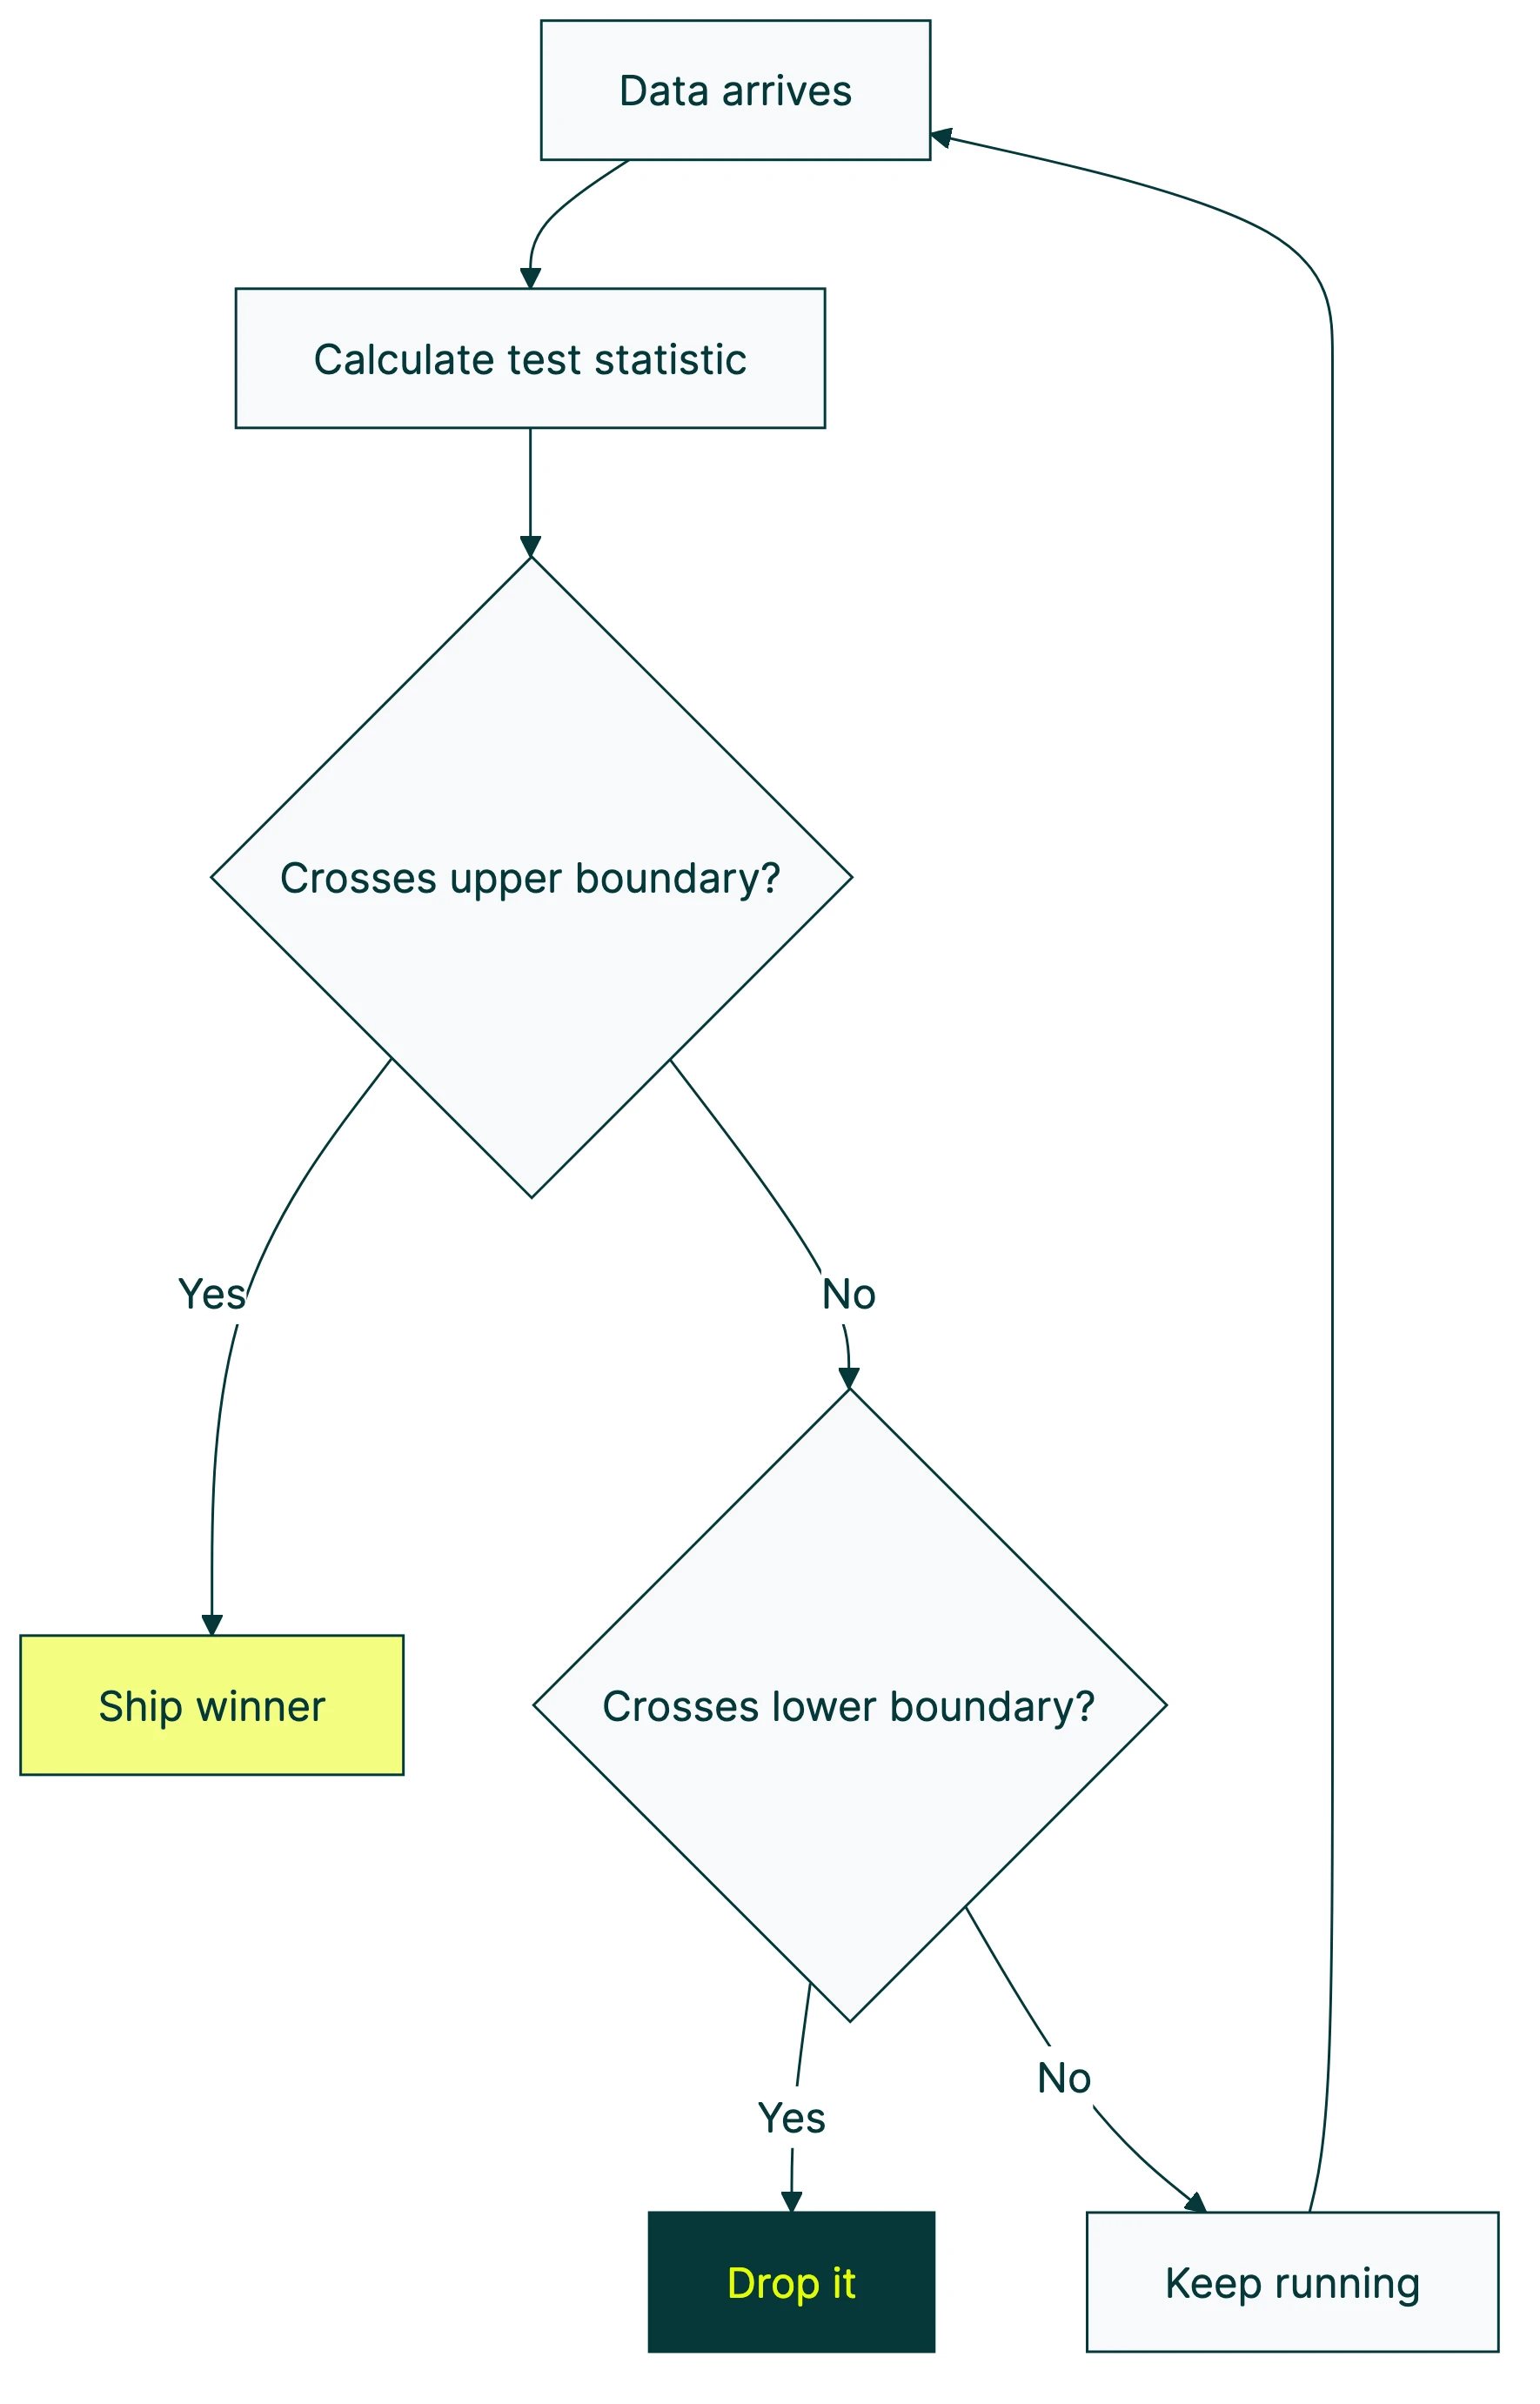
Picture two lines on a graph. One says “definitely working.” The other says “definitely not working.” Your test results bounce around between them as data comes in.
Cross the top line? The change works. Ship it. Cross the bottom line? The change flopped. Drop it. Still bouncing between the two? You don’t know yet. Keep collecting data.
The clever part: those boundary lines start wide apart and narrow over time. Early in the test, you’d need a massive difference to cross a boundary. Like, Version B would need to be 40% better.
Later, a smaller difference (say 5%) is enough to trigger a stop. This is what makes early stopping safe. You stop when the evidence is strong enough for how much data you have. The math decides, not your gut.
There are three main approaches, and you don’t need to understand the math. Just the trade-offs:
Group sequential tests (GST): You plan your check-in points ahead of time. Maybe every week for four weeks. This is the gold standard. Spotify uses it. Best statistical power (meaning it’s less likely to miss a real winner), but you have to commit to a schedule.
Always-valid inference (mSPRT): Check whenever you want, as often as you want. Optimizely and Netflix use this. More flexible than GST, but there’s a cost. It needs roughly 85% more visitors than a fixed-sample test to reach the same confidence, according to Analytics-Toolkit.
There’s also a simpler option: divide your confidence threshold by how many times you’ll check (Bonferroni correction). Easy to understand, but conservative. You’ll need more data because the math plays it extra safe.
The power trade-off is real. Sequential testing isn’t free. Spotify ran 100,000 simulated tests. mSPRT hit only 71 to 77% power. GST hit 90 to 93%. More flexible peeking means a higher chance of missing a real winner. That’s the price of flexibility.
Our take: Most teams should just pick a tool with sequential testing built in and stop worrying about which method it uses. The difference between GST and mSPRT matters to statisticians. For everyone else, “can I peek without lying to myself” is the real question. And both methods answer it with yes.
Sequential testing vs fixed-horizon testing: when to use each
This isn’t an either/or decision. It’s about matching the method to the situation.
Use sequential testing when:
- You have high-traffic pages and want results faster
- The test is expensive to run (every day showing a worse version costs money)
- Your team will peek regardless (better to build peeking into the method)
- You’re running a canary release or quality check, like Netflix does to catch bugs fast
Use a fixed-sample test when:
- Your traffic is low (sequential methods need more visitors, not fewer)
- You’re measuring something that takes time, like 30-day retention (you can’t stop a 30-day measurement after 7 days)
- Weekly patterns matter and stopping after 4 days would miss the weekend cycle
- You need precise effect size estimates (more on this in the next section)
- You’re running landing page split tests with limited traffic
You can also pair it with CUPED (variance reduction) to reach answers faster. Different problems, but they complement each other. And if your priority is minimizing losses during the test rather than waiting for a final verdict, bandit algorithms take a different approach by shifting traffic toward the better-performing version as data comes in. Many AI-powered testing tools now combine sequential monitoring with machine learning to automate these decisions.
| Factor | Sequential testing | Fixed-sample testing |
|---|---|---|
| Best for | High-traffic, short metrics | Low-traffic, long metrics |
| Peeking | Safe (built in) | Dangerous (inflates errors) |
| Speed for large effects | 30 to 75% faster | Slower |
| Speed for small effects | Can be slower | Predictable |
| Visitor requirement | Higher (mSPRT: ~85% more) | Standard |
| Effect size accuracy | Tends to overestimate | More precise |
The hidden downside nobody talks about: effect size inflation
Nobody talks about this part. And it matters.
When your test crosses that upper stopping boundary, you’re catching it at a random high point. The measured effect (say, “Version B lifts conversions by 15%”) is systematically larger than the true effect. Not because the math is wrong. Because you’re taking a photo of someone mid-jump and calling that their height.
This isn’t speculation. Research in Clinical Cancer Research (2012) found that clinical trials stopped early “typically overestimate the true effect size.” A Nature Communications study (2019) confirmed that sequential sampling biases both the significance finding and the effect size estimate.
Imagine you’re watching a stock ticker. It bounces up and down randomly. If you sell the moment it hits a new high, you feel like a genius.
But you didn’t predict the high. You just got lucky with timing. The stock’s real value is probably lower.
So you ship a change thinking it lifts conversion rates by 15%. The real lift? 8%. Still a win. The change worked.
But your expectations are off. Over time, this erodes trust in your testing program. Your boss starts asking why the “15% improvements” never show up in the revenue numbers.
What to do about it: Use sequential testing for the stop/go decision. That’s what it’s good at. But don’t over-promise based on the exact number you saw when the test stopped. The direction is right. The magnitude is optimistic. Report a range, not a point.
How to run a sequential test (step by step)
If you’re designing a marketing test, here’s how to do it with sequential monitoring.
Step 1: Pick one metric. One. Not five. Sequential testing protects one metric at a time. If you monitor 20 metrics and stop when any of them looks good, your error rate inflates again. Same peeking problem, different outfit.
Step 2: Set your minimum detectable effect. How big a difference matters to your business? A 2% lift? 10%? This determines how long the test could run. Smaller effects need more data. Check our guide on minimum detectable effect if you’re not sure how to pick this number.
Step 3: Estimate your needed visitors. Even with sequential testing, you need a rough target. Think of it as a worst-case scenario (the test runs to completion without early stopping). Use a sample size formula to get this number.
Step 4: Choose your tool. Most A/B testing tools handle sequential math for you. Kirro uses Bayesian statistics (math that works faster with smaller traffic) with built-in monitoring. You don’t need to configure anything. It watches the numbers and tells you in plain English when it’s confident. Try it on your own site. Takes about three minutes.
Step 5: Run the test and check at planned intervals. Daily or weekly is fine. Don’t refresh every hour. Each check costs a tiny bit of accuracy, even with sequential testing.
Step 6: When the tool says stop, stop. Trust the boundaries. If results are still between the lines, keep running. If they cross, act on the result. Don’t second-guess the math because your gut says otherwise.
Step 7: Report the result honestly. If you stopped early, note that the effect size might be optimistic. Give a range (“somewhere between 5% and 15% improvement”) rather than a single number. Your boss will appreciate the honesty more than a precise number that doesn’t hold up.
What your A/B testing tool handles (and what it doesn’t)
Modern tools like Kirro, Optimizely, Amplitude, Statsig, GrowthBook, and Eppo all have sequential testing built in. You don’t need to calculate stopping boundaries by hand. You don’t need to remember which correction method to apply. The tool does that.
What the tool handles:
- Adjusting confidence levels so peeking doesn’t inflate errors
- Drawing the stopping boundaries
- Telling you when results are strong enough to act on
What the tool doesn’t handle:
- Choosing the right metric (that’s on you)
- Deciding if the effect size matters to your business (a 0.5% lift might be statistically real but commercially useless)
- Accounting for seasonal patterns or novelty effects (people sometimes click a new button just because it’s new)
- Knowing whether your common A/B testing mistakes are in the setup, not the analysis
The tool is like a thermometer. It tells you the temperature accurately. But it can’t tell you whether you need a jacket. That’s your call.
Kirro’s approach: Bayesian statistics that naturally handle continuous monitoring. You see confidence levels in plain language. When Kirro says “Version B wins,” it’s already accounted for the peeking problem. No configuration needed, no statistics degree required. Set up your first test and see what happens.
Is Bayesian testing immune to the peeking problem?
This is a popular belief in the testing world: “Just use Bayesian statistics and you can peek all you want.” It’s mostly true. But not entirely.
Research from Optimizely, independent academics, and Variance Explained shows that Bayesian methods still produce elevated false positive rates under continuous monitoring. The elevation is less severe than with traditional stats tests, but it’s not zero.
Think of it this way: Bayesian testing is like wearing a seatbelt. It protects you from most crashes. But it doesn’t mean you should drive with your eyes closed. Sequential testing methods (whether Bayesian or traditional) add the equivalent of lane-keeping assistance. Extra protection on top.
Kirro uses Bayesian stats with built-in sequential monitoring. Belt and suspenders. You get the flexibility of Bayesian methods plus the peeking protection of sequential boundaries.
FAQ
Can I stop an A/B test early?
Yes, but only if your testing tool uses sequential testing methods. Most modern tools do. Without these protections, stopping early inflates your false positive rate to 26% or higher instead of the intended 5%. The key: let the tool tell you when to stop. Don’t decide based on a gut feeling or a screenshot from day two. Tools like Kirro handle this automatically. They tell you when the data is strong enough to act on.
What is the peeking problem in A/B testing?
The peeking problem is the statistical damage that happens when you check test results before the planned end date. Every peek is like running another test, which increases the chance of seeing a “winner” that’s just random noise. With continuous peeking, Optimizely found 57% of identical-version tests falsely declared a winner. Sequential testing fixes this by adjusting the confidence thresholds to account for multiple checks.
How does sequential testing work?
Sequential testing uses adjustable boundaries. They start wide (only a huge effect can stop the test early) and narrow over time (smaller effects can trigger a stop). This lets you check results periodically without inflating error rates. Think of it as a speed limit that changes based on road conditions. Going 100 on the highway is fine. Going 100 in a school zone is not. Sequential testing sets the right limit for each stage of your test.
Is sequential testing faster than regular A/B testing?
Sometimes. For large effects, sequential testing can end 30 to 75% earlier. But for small effects near your minimum detectable effect, it can actually take longer than a fixed-sample test. The adjusted boundaries require more data to detect subtle differences. The key factor is traffic volume. High-traffic sites benefit most because they accumulate data faster and are more likely to hit the boundaries early.
What’s the difference between sequential testing and multi-armed bandit testing?
Sequential testing decides when to stop while keeping the traffic split 50/50. Multi-armed bandit testing goes further. It also shifts traffic toward the better-performing version during the test. Sequential testing is simpler and gives more reliable statistical answers. Bandits minimize “wasted” traffic on the losing version but produce less precise effect estimates. If you care about measuring the true impact, sequential testing is the better choice. If you care about minimizing losses during the test, bandits are worth exploring.
Does sequential testing work with split testing?
Yes. Sequential testing is a monitoring method, not a testing type. It works with any A/B or split test setup. Whether you’re testing headlines, page layouts, or checkout flows, you can layer sequential monitoring on top. Most modern A/B testing tools include it by default.

Randy Wattilete
CRO expert and founder with nearly a decade running conversion experiments for companies from early-stage startups to global brands. Built programs for Nestlé, felyx, and Storytel. Founder of Kirro (A/B testing).
View all author posts