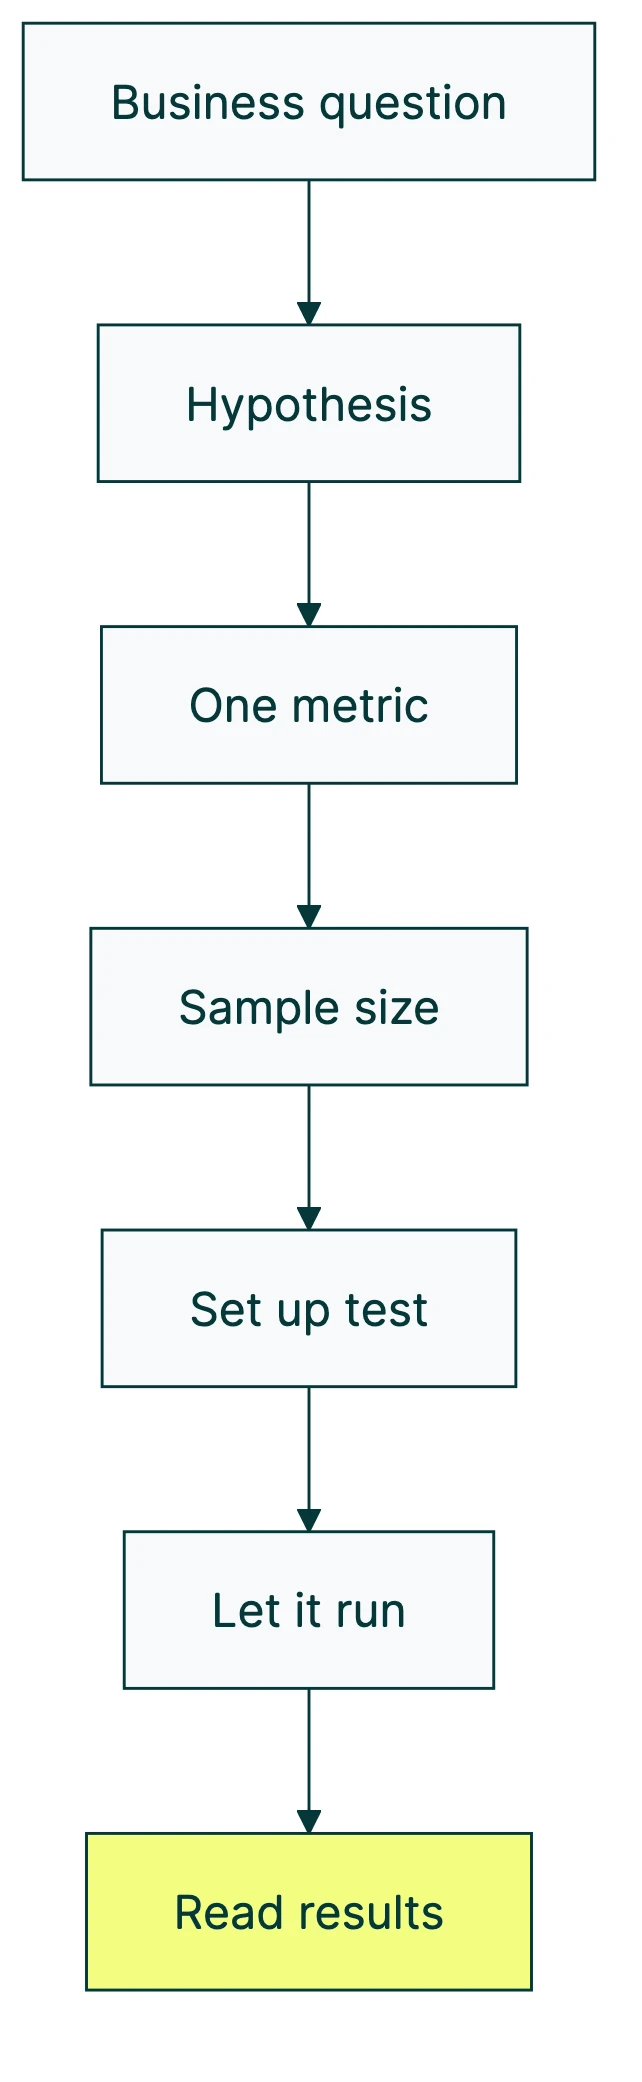
To design a marketing experiment: start with a business question, write a hypothesis you can be wrong about, pick one metric, figure out how many visitors you need, set up one change, let it run without peeking, and read the results honestly.
Seven steps. That’s the short version. The longer version matters because 88% of experiments don’t produce a winner, according to Optimizely’s analysis of 127,000 real tests. Most A/B testing experiments won’t find a winner. That’s not a flaw in the process. That’s the process working.
A well-designed test teaches you something whether it wins or loses. A poorly designed one wastes your time either way. The difference is in the setup, and getting your testing methodology right matters more than running more tests. That’s what this guide covers. (Need inspiration? The A/B testing ideas list has experiments filtered by page type and impact level.)
If you’re wondering how A/B testing improves conversion rates in the first place, start there. And for the best practices for A/B testing that separate teams who learn fast from teams who waste traffic, we have a dedicated guide. This post assumes you’re ready to build your first test and want to do it right. (If you’re a product manager, our A/B testing for product managers guide covers the PM-specific workflow.)
What is a marketing experiment (and why most of them fail)
You change one thing. You show the original to half your visitors and the changed version to the other half. Then you compare. Did more people sign up? Click? Buy? That’s it.
The concept is simple. The execution is where people get tripped up.
At Booking.com, 90% of their tests fail. They run 25,000 a year anyway. At Microsoft, roughly one third of tests are positive, one third are flat, and one third are negative. These are companies with thousands of engineers and mountains of data. Their tests still mostly don’t “win.”
So why do they keep testing? Because every test that doesn’t win still answers a question. “Does changing the headline matter?” If the answer is no, you just saved yourself from redesigning a page that didn’t need it. That’s useful.
The goal of a marketing experiment isn’t to find winners. It’s to stop guessing. And when you design your test properly, even a “no difference” result is worth something.
The 7-step marketing experiment design framework
This framework uses a single worked example throughout: testing a homepage headline. By the end, you’ll have a template you can apply to any test on your site.
Step 1: start with a business question, not a test idea
Bad starting point: “Let’s test a red button vs. blue button.”
Good starting point: “Our homepage gets 5,000 visitors a month but only 2% sign up. What if the headline doesn’t match what visitors expect?”
The difference? The first is a guess. The second comes from looking at your numbers and noticing something worth investigating. Maybe your analytics show high traffic but low signups. Maybe customers tell you they didn’t understand what you do from the homepage. Maybe you looked at a competitor’s page and thought “wait, their messaging is completely different.”
The question comes from your data, your customers, or a pattern you noticed. Not from a brainstorm session where someone says “what if we tried purple?”
For help figuring out which pages to focus on, check out our guide to landing page optimization.
Step 2: write a hypothesis you can be wrong about
Here’s a template that works every time:
“If we [change X], then [metric Y] will [increase/decrease] by [amount] because [reason].”
The “because” is the most important word. It forces you to explain WHY the change might work. Without it, you’re just guessing with extra steps.
Our worked example: “If we change the headline from ‘Project management software’ to ‘Stop losing track of tasks,’ then signup rate will increase by 15% because visitors care more about the problem being solved than the product category.”
Notice two things. First, you can be proven wrong. If signups stay flat, the hypothesis failed. Good. Now you know. (For more on how null and alternative hypotheses work in testing, see our dedicated guide.) Second, the “because” gives you something to learn from even if the test loses. Maybe visitors DO care about the problem, but 15% was too ambitious. Or maybe they care about the category after all. Either way, you learned something.
A hypothesis you can’t be wrong about isn’t a hypothesis. It’s a wish. If you’re stuck on the format, our tool can help you generate your A/B test hypothesis step by step.
Step 3: choose one metric and lock it in
This is the step most people skip. It’s also the most costly one to skip.
Say you’re running a headline test. You decide to measure signup rate. Great. But then the test starts and you notice bounce rate dropped too. And time on page went up. And scroll depth improved. Suddenly you’re looking at four metrics and one of them shows a “win.”
The problem: if you measure enough things, something will look like it worked purely by chance. Flip a coin 20 times and you’ll hit five heads in a row eventually. That’s not a pattern. That’s just what randomness looks like when you stare at it.
Statistician Andrew Gelman calls this the “garden of forking paths”. You don’t need to cheat your data to get a misleading result (a “false positive,” in stats speak). You just need to decide what to measure after you’ve seen the data. Even well-meaning people fall into this.
Joe Wyer, Head of Science at Haus (a company that’s evaluated over $1B in test results), says pre-commitment is the most commonly skipped and most costly step in experiment design.
The fix is simple. Before you launch, write down three things:
- Your primary metric (signup rate)
- What counts as a win (10% improvement or more)
- How you’ll decide (if Kirro says it’s confident, ship it)
You can track secondary metrics. They’re fine for context. But they inform your understanding. They don’t change your decision.
For help picking the right metric, see our guide on CRO metrics. And for the full A/B testing metrics taxonomy (primary, guardrail, secondary, and data quality), we have a dedicated guide.
Our take: Write your success criteria on a Post-it and stick it to your monitor. If you haven’t decided what “winning” means before you launch, you’ll find a way to see a win in anything. Pre-commitment sounds boring. It’s the most useful 30 seconds you’ll spend on any test.
Step 4: figure out how many visitors you need (and how long to run)
This is where most guides stop. “Analyze your results.” Cool. How?
Two concepts matter here, and neither requires a math degree.
How many visitors you need (the technical term is sample size) depends on how big a difference you’re looking for. If your headline change boosts signups by 50%, you’ll spot that quickly. If it boosts them by 5%, you need way more visitors. Otherwise you can’t tell the difference between a real improvement and random noise.
The smallest difference you’re looking for has a name: minimum detectable effect. A good rule of thumb for most small sites: set it to 10-20%. Looking for tiny 2% improvements requires huge traffic, and the improvement probably isn’t worth the effort anyway.
If your test doesn’t have enough visitors, you’ll run for weeks and learn nothing. That’s called an underpowered test. It’s the most common time-waster in A/B testing. More on that in our guide to statistical power and power analysis. You can also use CUPED for faster results by removing predictable noise from your data before the test even starts.
Tools like Kirro calculate this for you. Tell it your current conversion rate, how big an improvement you want to detect, and your daily traffic. It tells you how many visitors you need and roughly how long the test will run. Keep in mind that cookie consent banners can shrink your testable audience significantly. Our guide on running tests without third-party cookies explains how to plan for that.
Step 5: set up the test (one change at a time)
You have your original page (the one visitors see today) and your changed version (with the new headline). The original is your control — see our guide on setting up a control group if you’re not sure what that means. Split your traffic 50/50. Half see the original, half see the new version.
The golden rule: change one thing per test. If you swap the headline AND the button AND the hero image, and conversions go up, which change caused it? You don’t know. You can’t know. And you can’t repeat what you can’t identify. If this is your first test with a new tool, consider running an A/A test before your experiment to verify that your setup, tracking, and traffic split are working correctly.
If you want to test multiple changes at once, that’s called multivariate testing. It works, but it requires significantly more traffic. Think 50,000+ monthly visitors on the test page. For most teams, single-variable testing is the move.
Setting up the test itself is straightforward. In Kirro, you click on the element you want to change, type your new version, and set your conversion goal (like “clicked the signup button”). Three minutes, start to finish. No developer needed.
For a deeper look at the different types, check out what split testing means and our landing page split testing playbook.
Step 6: let it run (and resist the urge to peek)
This is the hardest step. Not because it’s complicated. Because it requires patience.
Ron Kohavi built Microsoft’s experimentation platform, then led experimentation at Airbnb and Amazon. In his book Trustworthy Online Controlled Experiments, he explains the peeking problem. Check your results early, stop when something looks exciting, and you inflate the chance of seeing a “win” that’s just noise.
Think of it like this. You start a new diet and weigh yourself every hour. After lunch you’re down half a pound. Success? No. You just haven’t digested yet. Daily fluctuations aren’t real progress. You need weeks before the trend means anything.
Same with your test. Day two data is noise. Week two data starts to be useful. If you truly can’t wait, sequential testing lets you check at planned intervals without breaking the math.
How long is long enough? At minimum, one full business cycle. If your weekday traffic looks different from your weekend traffic (it almost certainly does), you need at least two full weeks. Your sample size calculation from Step 4 gives you the specific number.
There’s also the novelty effect. Sometimes a new design gets a short-term bump because it’s, well, new. Run long enough and the novelty fades. What’s left is the real performance.
Kirro tells you when you have enough data. It uses math that works with smaller traffic (called Bayesian statistics), so you’re not waiting longer than necessary. But you’re also not stopping too early. Trust the tool, not your gut.
Our take: We’ve seen teams stop tests after 3 days because “the numbers looked good.” Half the time, the “winner” reversed by week two. Set your runtime, close the tab, and come back when Kirro says it’s ready. The urge to peek is strong. Resist it.
Step 7: read the results honestly
Your test is done. Time to read the results. There are three possible outcomes:
A clear winner. Version B gets more signups. The tool is confident the difference is real, not random. Ship it.
A clear loser. Version B did worse. Also useful. You now know that change hurts performance. Don’t do it again.
No meaningful difference. Both versions performed about the same. This is the most common outcome. And it’s NOT a failure. It tells you that this particular change doesn’t matter much. Stop tweaking it and test something bigger.
Kirro shows results in plain language: “Version B gets 23% more signups. Kirro is confident this works.” No p-values, no confidence intervals, no decoding statistical tables. Just a straight answer. (If you’re curious about the math behind it, we have guides on Bayesian A/B testing and Type 1 and Type 2 errors.)
The key is honesty. If the result is flat, don’t go hunting through secondary metrics for something that looks like a win. Remember Step 3? You already decided what winning looks like. Stick with it.
Design of experiment: 3 types of marketing experiments
The phrase “design of experiment” (or DOE) comes from manufacturing, where engineers test multiple variables at once in controlled environments. In marketing, the concept is the same but the methods are simpler. Three types cover 95% of what you’ll need.
| Type | What it is | Best for | Traffic needed |
|---|---|---|---|
| A/B testing | Two versions, split traffic, compare | Headline changes, button tweaks, layout adjustments | 1,000+ visitors/month |
| Split URL testing | Two completely different pages at different URLs | Radical redesigns, totally different approaches | 1,000+ visitors/month |
| Testing multiple things at once | Several changes tested simultaneously (multivariate testing) | Finding the best combination of elements | 50,000+ visitors/month |
A/B testing is the default. One change, two versions, split traffic. If you have one clear idea to test, this is your move. For example, pricing experiments often start as simple A/B tests comparing two price points or page layouts.
Split URL testing sends visitors to completely different pages. Use this when the change is too big for a quick edit, like testing a totally new landing page against your current one.
Multivariate testing finds the best combination of several changes at once. Sounds great, but you need a LOT more traffic. Each combination needs enough visitors to produce reliable data. Most teams never need this.
There’s also a fourth option worth knowing: multi-armed bandit algorithms automatically shift traffic toward the better-performing version during the test. They’re ideal for time-sensitive campaigns where you want to minimize losses while still learning which version works. For a broader look at methods beyond A/B testing, including options for low-traffic sites, we have a dedicated guide.
Marketing experiment design mistakes that waste your budget
Testing random ideas instead of researched hypotheses. “Let’s try a green button” is not a strategy. It’s a lottery ticket. Why do you think the green button will work? If you can’t explain it, don’t test it.
The most common one? Stopping too early. Two days of data is a coin flip, not a test. Your sample size calculation tells you how long to run. Stopping before that number is like calling a game at halftime.
Changing the goal mid-test. You said you’d measure signups. The test is running. Now scroll depth looks better in Version B. Tempting to claim that as a win, right? Don’t. That’s the garden of forking paths from Step 3.
And finally: not writing anything down. If you don’t document the result and the lesson, you’ll re-run the same test in six months. Keep a simple log. What you tested, what happened, what you’ll do next. Our A/B testing template gives you a ready-made format for this.
For the full list of testing pitfalls (and there are more), see our guide on common A/B testing mistakes.
What to do when your experiment doesn’t produce a winner
So your test didn’t find a winner. Now what?
Remember that Optimizely stat from the top? 88% of experiments don’t produce a clear positive result. At Microsoft, only a third of tests are positive. Jakob Nielsen analyzed 74 A/B tests and found only 31% produced confident results. This is the reality of testing. Not the exception. The rule.
An inconclusive result is your test telling you: “That variable probably doesn’t matter much.” Good to know. Now test something bigger.
Optimizely’s data backs this up: tests with significant UX changes are 25% more successful than minor tweaks. If your headline test didn’t move the needle, don’t try a slightly different headline. Try a completely different approach to the page.
Three scenarios:
- Directionally positive but not confident? Your test showed a small improvement but didn’t have enough visitors to be sure. Run longer, or (better) make the change bolder. A bigger swing produces a clearer result.
- Completely flat? Both versions performed identically. The thing you changed doesn’t matter to visitors. Stop fiddling with it and test something else.
- Negative? Version B was worse. Also useful. You now know what NOT to do. One less wrong turn.
HBR research by Amano and Joo found that chasing perfect confidence can require 24 to 55 times more data than you need. For small teams with limited traffic, “probably better” is often good enough.
One more thing worth knowing: as you get better at testing, your individual wins get smaller. Nielsen found this across mature testing programs. That’s not failure. You’ve already picked the easy wins. The remaining gains are smaller, but they still add up.
Our take: A “failed” test that costs you two weeks is still cheaper than a redesign that costs you two months and makes things worse. Testing is how you avoid expensive mistakes. The test that shows “no difference” just saved you from wasting time on something that doesn’t work.
FAQ
How do I design a marketing experiment?
Start with a business question based on your data (not a random idea). Write a hypothesis with a “because” (If we change X, then Y will happen because Z). Pick one metric and lock it in before launching. Calculate your sample size. Set up the test with one change. Let it run without peeking. Read the results honestly. The 7-step framework above walks you through each step with a worked example.
What makes a good A/B test hypothesis?
A good hypothesis has three parts: what you’ll change, what metric you expect to move, and why you think it will work. The “why” separates a hypothesis from a guess. Template: “If we [change], then [metric] will [direction] because [reason].” If you can’t fill in the “because,” you’re not ready to test yet.
How long should a marketing experiment run?
At minimum, one full business cycle (usually two weeks). Your exact runtime depends on your traffic and the size of the difference you’re looking for. More traffic and bigger expected changes mean shorter runtimes. Use a sample size calculator to get a specific number. Here’s how the formula works.
What is a design of experiments (DOE) in marketing?
In manufacturing, DOE is a formal method for testing multiple variables at once. In marketing, it usually means multivariate testing: running combinations of changes to find the best mix. It works, but it requires a lot more traffic than simple A/B testing. Most marketers should start with A/B tests (one change at a time) and graduate to DOE only when single-variable tests aren’t enough.
What percentage of marketing experiments succeed?
About 10 to 20% produce a clear positive result. Optimizely found that 88% of 127,000 tests didn’t produce a clear positive result. Microsoft sees roughly one third positive, one third flat, one third negative. Sounds discouraging, but it’s normal. The goal isn’t a high win rate. It’s making better decisions by testing instead of guessing. Every “failed” test still teaches you something.

Randy Wattilete
CRO expert and founder with nearly a decade running conversion experiments for companies from early-stage startups to global brands. Built programs for Nestlé, felyx, and Storytel. Founder of Kirro (A/B testing).
View all author posts