The CRO metrics that matter most are segmented conversion rate, revenue per visitor, and bounce rate by traffic source. Not the 15 metrics your analytics dashboard shows you by default. Most teams track too many numbers and act on none of them. That’s not measurement. That’s hoarding. Getting the CRO fundamentals right starts with picking the right numbers.
This guide sorts conversion rate optimization metrics into three buckets. What predicts revenue. What just describes what already happened. And what you can safely ignore. SaaS, ecommerce, and lead gen each need a different metric stack. We’ll cover that too.
The CRO metrics that actually matter (and the ones that don’t)
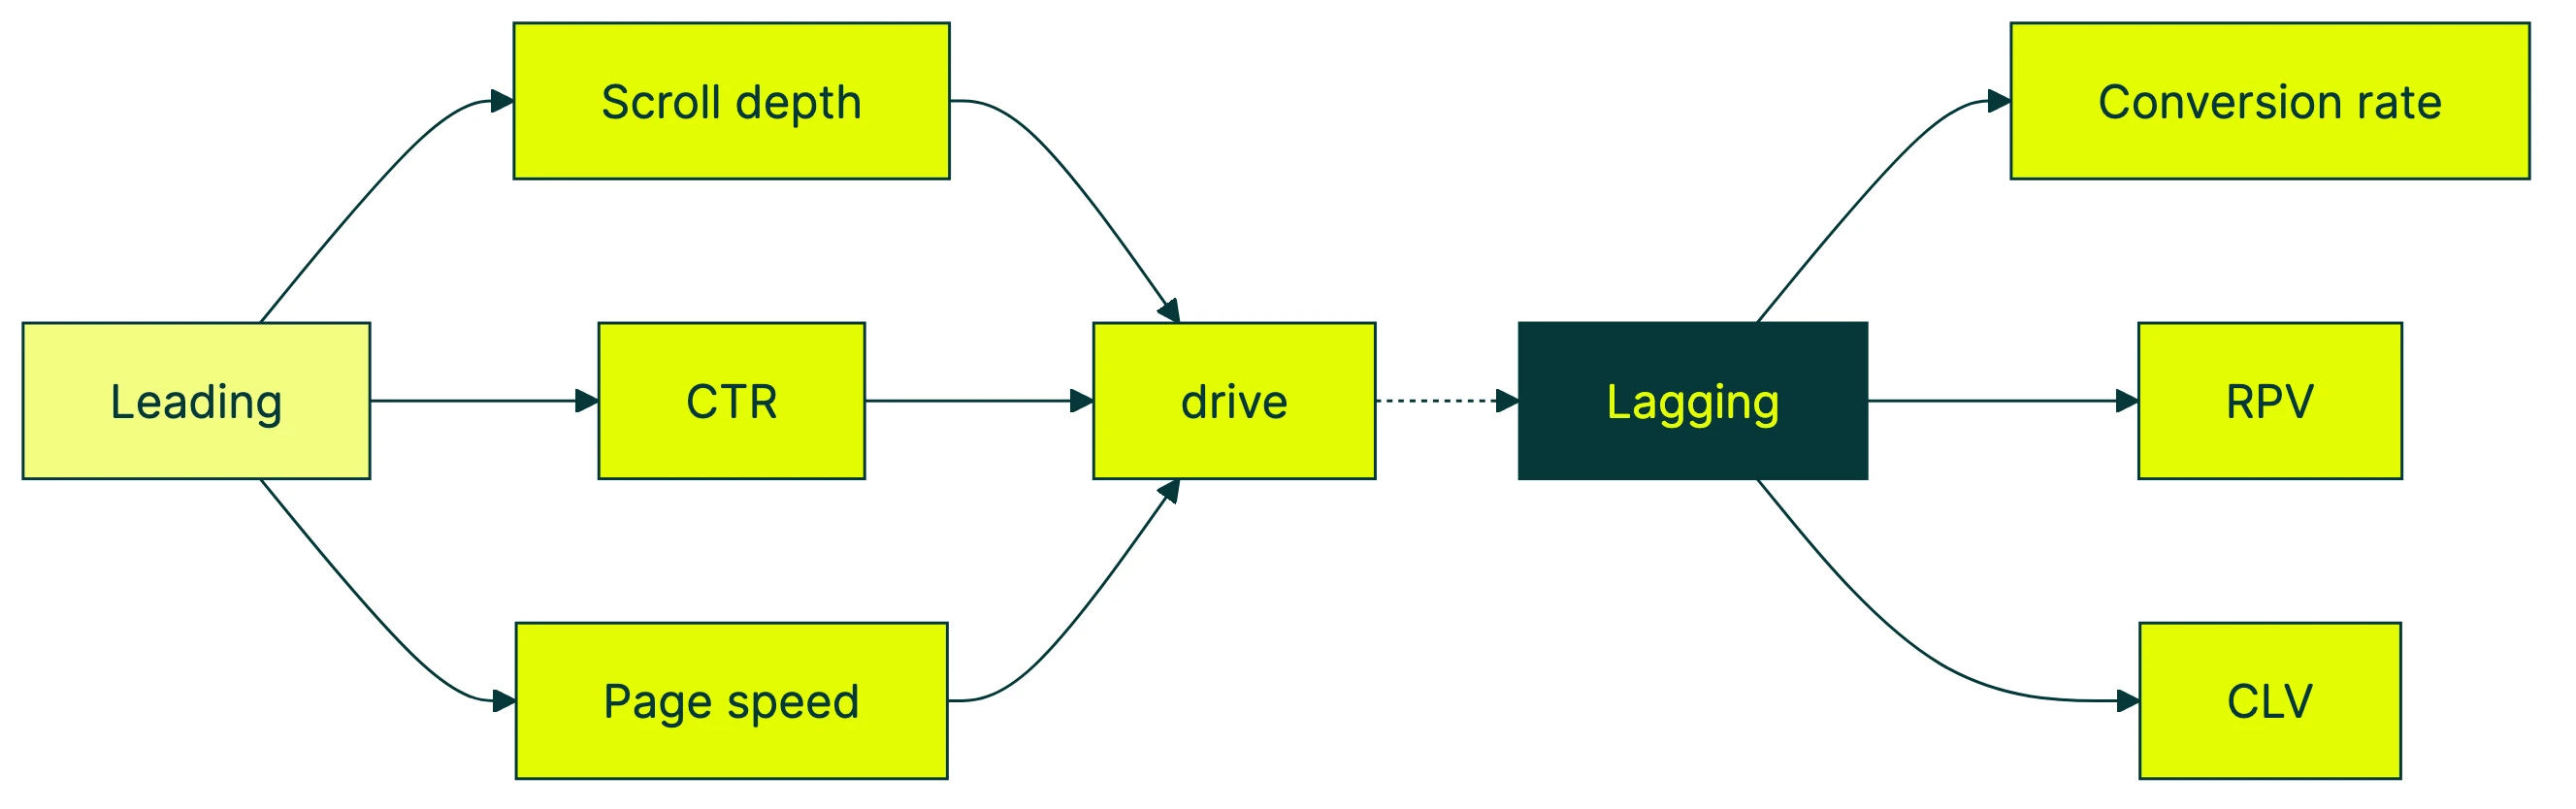
There are two types of CRO metrics. Leading indicators are numbers you can influence right now. Think scroll depth, form starts, or page load time.
Lagging indicators are outcomes. Conversion rate, revenue, customer lifetime value. They tell you what happened, but not why.
Most teams obsess over lagging indicators. They stare at conversion rate all day like it’s a stock ticker.
But conversion rate is a scoreboard. It shows the final score after the game is over. The leading indicators are what happens during the game.
Amplitude’s North Star framework makes this clear. Conversion rate is a lagging indicator. It reacts to everything else.
If you want to improve it, track what drives it. How far people scroll. Where they click. How fast your page loads.
Our take: If you can’t change a metric this week, it’s a lagging indicator. Track it monthly. Focus your daily energy on the leading stuff you can actually fix.
The other split that matters: vanity vs. actionable. A vanity metric makes you feel good without telling you what to do.
Total pageviews? Vanity. Pageviews segmented by traffic source with bounce rate attached? Actionable. The difference is whether the number points to a next step.
The 10 CRO metrics every business should track
1. Conversion rate (segmented, not aggregate)
The percentage of visitors who do the thing you want. Buy something, sign up, fill out a form. Formula: conversions divided by total visitors, times 100. For a full walkthrough of the conversion rate calculation and its variations by platform, see our dedicated guide. If your ad dashboards show “CVR” instead of “conversion rate,” it’s the same metric — our CVR explainer covers how each platform calculates it differently. You can also run that math instantly with our conversion rate calculator if you’re pulling numbers from a campaign report.
Benchmarks vary wildly. Littledata puts the average Shopify store at 1.4%, with the top 10% hitting 4.7% (see our full breakdown of tracking ecommerce conversion rates in Google Analytics). Unbounce found landing pages average 6.6% across 41,000 pages. SaaS landing pages sit around 3.8%. For a deeper look at good conversion rate benchmarks by industry and business model, we wrote a full guide. For SaaS benchmark data specifically, we break down rates by funnel stage and pricing model. And if you’re building a measurement plan, our guide to the conversion rate metrics to track covers which rates deserve a spot on your dashboard.
Track each goal conversion rate individually rather than lumping them together. The number that matters most here: always segment by traffic source, device, and new vs. returning visitors. An aggregate conversion rate is almost useless (more on that in a bit). Someone arriving from an email link converts differently than someone from a TikTok ad. Lumping them together hides what’s actually working. If you’re using Google Analytics, our guide to conversion rate in GA4 shows exactly where to find and segment these numbers.
2. Revenue per visitor (RPV)
Total revenue divided by total visitors. This is better than conversion rate alone because it accounts for order value. A page that converts 2% of visitors at $200 each beats a page converting 4% at $30 each.
Dynamic Yield tracks this across 400+ brands. The range is huge. Luxury brands see average order values of $349 to $401. Pet care averages $68. RPV depends on your industry, so benchmark against yourself over time.
3. Bounce rate (by traffic source)
The percentage of visitors who left without doing anything. No clicks, no scrolls, just… gone.
Contentsquare’s 2025 benchmark (90 billion sessions across 6,000 sites) found paid social traffic bounces 9.2% more than organic search traffic. That’s a traffic quality problem, not a page problem.
A high bounce rate on a blog post might actually be fine. If someone Googled a question, found your answer, and left satisfied, that’s a win. Avinash Kaushik (former Google analytics evangelist) has been saying this for years.
Context matters more than the number itself. That’s one reason why balancing CRO and SEO is tricky. A page that ranks well might bounce high because it answers the question fast.
4. Cart abandonment rate (ecommerce)
Baymard Institute analyzed 50 studies spanning 2006 to 2025. The average cart abandonment rate across all of them: 70.22%. Seven out of ten people who add something to their cart don’t buy it.
The top reasons? 39% cite extra costs (shipping, taxes, fees). 21% say delivery was too slow. 19% didn’t trust the site with their credit card. And 19% were forced to create an account.
43% of those abandoners told Baymard they were “just browsing.” They were never going to buy. Not all cart abandonment is a problem to solve. Some of it is just window shopping.
5. Form abandonment rate (lead gen and SaaS)
This one gets overlooked, but it’s important if your conversion is a form submission (B2B, SaaS trials, service quotes). Track which specific fields cause people to bail. Name and email? Fine. Phone number? Watch the drop-off spike. Our guide to form-specific metrics breaks down benchmarks by form type and field count.
The fix is usually simpler than you’d think. Fewer fields, clearer labels, save progress. A proper CRO audit will usually catch these immediately. But you can’t fix it if you’re not measuring which field kills the form.
6. Click-through rate on your calls to action
Not ad CTR (for the ad-level metric, see click-through rate vs conversion rate). This is the click rate on the buttons and links on your actual pages. “Start free trial,” “Add to cart,” “Get a quote.” If nobody’s clicking your main button, nothing downstream matters.
Track this per page. A 2% CTR on your homepage button versus 8% on a landing page tells you something specific about each page’s persuasion. CRO tools make this easy to measure and test.
7. Average session duration and time on page
How long people spend on your page. Be careful with this one though. Long sessions on a pricing page usually mean confusion, not interest.
Short sessions on a blog post might mean they found what they needed fast.
Pair this with scroll depth for a fuller picture. Someone who spent 30 seconds and scrolled 80% of the page read fast. Someone who spent 3 minutes and scrolled 10% got stuck at the top.
8. Scroll depth
How far down the page people get. Industry benchmarks say 60 to 80% is “good.” But the real insight is simpler. If visitors aren’t scrolling past the fold (the visible part without scrolling), nothing below it matters.
This is a leading indicator. You can fix it this week by changing what’s above the fold. Better headline, stronger hook, clearer value statement.
9. Customer lifetime value (CLV)
How much revenue one customer generates over their entire relationship with you. Simple version: average order value times purchase frequency times how long they stay.
For SaaS, it’s usually average revenue per account times gross margin, divided by churn rate (the percentage of customers who cancel each month).
McKinsey found that personalization drives 10 to 15% revenue lifts. CLV is where that improvement shows up. It doesn’t appear in your weekly conversion rate. It appears six months later when those customers are still around and spending more.
10. Customer acquisition cost (CAC)
How much it costs to get one new customer. Total marketing and sales spend divided by new customers acquired.
The ratio that matters: CLV to CAC. You want at least 3:1. If you spend $100 to acquire a customer worth $300 over their lifetime, that’s healthy. Below 3:1, you’re probably losing money on acquisition.
Forrester data shows CX leaders (companies with the best customer experience scores) see 41% faster revenue growth and 51% better retention. Good CRO doesn’t just improve conversion rates. It reduces what you spend to get each customer.
Which CRO metrics matter for your business model
This is the part every competitor skips. They give you a flat list of 14 metrics like they’re all equally important. They’re not.
Dynamic Yield’s benchmark data shows pet care sites convert at 7.32% while luxury sites convert at 0.9%. Different business models need different scorecards.
| Metric | SaaS | Ecommerce | B2B Lead Gen |
|---|---|---|---|
| #1 priority | Trial-to-paid rate | Cart abandonment rate | Form abandonment rate |
| Revenue signal | CLV:CAC ratio | Revenue per visitor | Cost per lead |
| Quality check | Activation rate (did they actually use the product?) | Product page conversion rate | How many leads become real sales conversations (MQL-to-SQL rate). See lead generation conversion metrics and lead conversion rate benchmarks for industry data. |
| Retention flag | Cancellation rate (churn) | Return rate | Time to close |
| Growth lever | Feature adoption | Average order value | Lead quality score |
Our take: Pick five metrics for your business model. Put them in a dashboard. Ignore everything else until those five are healthy. We’ve seen teams track 20 metrics and improve none of them.
Your CRO metrics dashboard blueprint
Most people get the “what to track” part right. They get the “when to check” part wrong.
Looking at CLV every day is like weighing yourself every hour. You’ll see fluctuations that mean nothing and make decisions you’ll regret.
Check daily:
- Conversion rate by traffic source (not aggregate)
- Bounce rate by channel
- Page load time
Check weekly:
- Funnel drop-off rates (where are people falling out?) Start by understanding your conversion funnel so you know which stages to watch, then use a funnel analysis framework to quantify the drop at each step.
- Scroll depth on your key pages
- Form abandonment rates
- Click-through rate on main calls to action
Check monthly:
- Customer lifetime value
- Customer acquisition cost
- Revenue per visitor trends
- Customer satisfaction scores
The cadence matters because different metrics move at different speeds. Bounce rate can spike overnight if a campaign sends cold traffic. CLV takes months to shift.
Checking them at the wrong rhythm either makes you panic over noise or miss real problems.
Tools like Kirro surface the CRO metrics that matter during A/B tests. Conversion rate by version, segmented by traffic source. So you’re never fooled by aggregate numbers. For a deeper look at which metrics matter specifically inside a test (primary vs. guardrail vs. secondary), see our A/B testing metrics guide.
If you want to track how your tests actually affect these metrics, you can set up a free test in about three minutes and watch real data come in.
Why your conversion rate might be lying to you
Every CRO article leads with conversion rate as THE metric. Nobody warns you it can be misleading.
Contentsquare’s 2025 benchmark report tracked 90 billion sessions across 6,000 websites. Conversion rates dropped 6.1% year over year. Sounds alarming, right?
But the on-site experience didn’t get worse. Paid social traffic grew 12%, bringing colder audiences who were never going to buy. The traffic mix changed. The pages didn’t. This is why optimizing across digital channels requires channel-aware measurement, not a single aggregate rate.
CRO consultant Will Laurenson puts it bluntly: “For ecommerce brands scaling past $1M, overall conversion rate is a vanity metric.” Traffic quality moves aggregate conversion rate more than anything you do on the page.
Avinash Kaushik backs this up. Only 20 to 40% of website traffic is in buying mode. The rest are browsing, researching, comparing. Measuring all of them against “did they buy” is grading fish on their ability to climb trees.
The fix: always segment. New vs. returning. Traffic source. Device. Intent stage. When you do, you’ll often find that your pages are converting fine. It’s the traffic that changed.
Revenue per visitor is a better north star than conversion rate alone. It captures both how well your A/B tests improve conversions and how much each buyer spends. And it’s harder to fake with traffic mix changes.
How to measure CRO success beyond conversion rate
If someone tells you they win 80% of their A/B tests, they’re either lying or running bad tests. Ton Wesseling estimates that about 50% of measured A/B test “winners” are false positives.
The math says they won, but it was noise, not signal. The technical term is false discovery rate. Plain-language version: your winning test might not actually be winning.
So if win rate is unreliable, what should you measure?
Revenue per visitor trend over time. Not the absolute number. The trend. Is it going up quarter over quarter? That’s CRO working.
Task completion rate. Kaushik’s method: ask three questions on your site. What’s your purpose? Did you complete it? What stopped you? The answers tell you more than any analytics dashboard.
Learning velocity. How many genuine insights per test? A “failed” test that teaches you something about your audience is worth more than a “winner” that you can’t explain.
Forrester’s CX data backs this up. Companies with the best customer experience grow revenue twice as fast as the rest. The ones winning at CRO aren’t running more tests. They’re learning faster from each one.
Kirro uses Bayesian statistics, which is math that works with less traffic. It tells you when a test has enough data for a reliable answer. No guessing whether a metric moved because of your change or random noise.
You can try it on your own site and see how it works.
CRO veteran Craig Sullivan describes a maturity curve. Teams start by measuring short-term conversion metrics. As they mature, they shift toward CLV, repeat purchase rate, and customer satisfaction. The metrics you track say a lot about your experimentation program maturity. If you’re unsure which metrics deserve attention first, what a CRO consultant looks for can help you prioritize.
The best CRO testing programs aren’t chasing conversion rate. They’re building long-term customer value. Ready to start your CRO journey? Our beginner-friendly guide covers the full process. Our CRO strategy guide explains how to connect these metrics to a testing roadmap that compounds over time. When evaluating CRO service proposals, these are the metrics that separate real programs from vanity plays. If you want to go deeper, some of the best CRO blogs cover this evolution well.
FAQ
What are the key metrics of CRO?
Conversion rate (segmented by traffic source), revenue per visitor, bounce rate by channel, and customer lifetime value. The right mix depends on your business model.
SaaS companies should prioritize trial-to-paid rate and churn. See our trial conversion benchmarks for industry baselines. Ecommerce: cart abandonment and average order value. B2B lead gen: form abandonment and MQL-to-SQL rate.
What is CRO in analytics?
CRO in analytics means using data to find where visitors drop off. Then testing changes to improve the percentage who convert. That could be a purchase, a signup, or a form submission.
The analytics side tracks which pages lose visitors, which traffic sources convert best, and whether your changes actually helped.
How do you measure CRO?
Track a primary metric (segmented conversion rate or revenue per visitor), supporting metrics (bounce rate, scroll depth, form abandonment), and business outcomes (CLV, CAC).
Compare before and after with proper A/B testing. Not just “we changed the page and traffic went up.” Without a control group, you can’t know what caused the improvement. More on the methodology in our guide to A/B testing and conversion rates.
What are the most important CRO metrics for ecommerce?
For ecommerce: cart abandonment rate (70.22% average per Baymard Institute), revenue per visitor, average order value, product page conversion rate, and return rate. Our ecommerce conversion optimization guide covers the full strategy, and the ecommerce CRO checklist shows how to act on these numbers with specific tests.
Don’t obsess over aggregate conversion rate. Segment by traffic source. Contentsquare found paid social converts 10.6% lower than organic. A drop in overall CR might just mean your ad budget grew.
How do you measure CRO success?
Don’t measure by A/B test win rate. Roughly 50% of measured “winners” are false positives due to the false discovery rate.
Instead, measure by revenue per visitor trend over time, learning velocity (genuine insights per test), and CLV improvements. A CRO audit can help you benchmark where you stand today. For methods that reduce false positives, look into Bayesian A/B testing.

Randy Wattilete
CRO expert and founder with nearly a decade running conversion experiments for companies from early-stage startups to global brands. Built programs for Nestlé, felyx, and Storytel. Founder of Kirro (A/B testing).
View all author posts