Ecommerce conversion optimization is making more of your store’s visitors buy something, without spending more on ads or traffic. Picture two stores, both getting 10,000 visitors. One makes 100 sales. The other makes 200. Same traffic. Double the revenue.
Most online stores convert between 1.6% and 2.8% of visitors into buyers. That means 97 out of 100 people leave without buying. The opportunity sitting inside your existing traffic is enormous, and it’s cheaper to capture than running more ads.
This guide covers what ecommerce conversion optimization actually involves and what “good” looks like for your industry. Plus, how to tell if you’re ready to start testing. If you want the tactical checklist (specific test ideas, page by page), head to our ecommerce CRO checklist. This post is the “why and what” that comes first.
What is ecommerce CRO?
Ecommerce conversion rate optimization focuses on one thing: getting a higher percentage of your existing visitors to buy. Not more traffic. Not more ads. Just more sales from the people already showing up.
Think of your store like a bucket. You pour visitors in through ads, search, social, email. But the bucket has holes. Visitors leak out on slow pages, confusing product pages missing best practices for ecommerce product pages, or a clunky checkout. Ecommerce conversion optimization is plugging those holes.
It’s different from general marketing in one important way. Marketing brings people to the door. Conversion optimization gets them through the register. You need both, but most stores over-invest in the first and ignore the second.
It’s also different from general CRO (which applies to any website). Our ecommerce CRO guide covers why: ecommerce has challenges that SaaS or B2B sites don’t face. Product discovery, cart behavior, shipping expectations, payment options, return policies. A conversion funnel for an online store has more stages and more places where things break.
Our take: Most stores spend 90% of their budget getting visitors and 10% converting them. That ratio is backwards. Fixing your checkout costs less than another month of Facebook ads.
Why ecommerce conversion optimization matters
Let’s do some quick math. Say your store does $500,000 a year with a 2% conversion rate. If you improve that to 2.5%, you’ve just added $125,000 in annual revenue. No extra ad spend. No new traffic source. Just more people buying from the same pool.
On a $2 million store, that same half-point lift is worth $500,000.
These gains compound. An ad campaign runs for a month and stops. A conversion improvement keeps working on every visitor, forever. A better checkout page doesn’t expire. A clearer product description doesn’t need a monthly budget.
Think about cost, too. Getting a new visitor through paid ads costs money every time. Converting a visitor you already have costs nothing extra. When you track CRO metrics like revenue per visitor alongside conversion rate, the math gets even more convincing.
Most people don’t realize this: ecommerce conversion rates are actually going down. IRP Commerce data shows the average dropped from 1.97% in 2023 to 1.65% in 2024. That’s a 16% decline in one year. The likely cause is more paid traffic from lower-quality sources pulling the average down.
That makes conversion optimization more important, not less. Even if you’re doing everything right, rising ad costs and weaker traffic quality are working against you. The stores that actively work on conversions are pulling ahead. The ones that don’t are falling behind.
What a good ecommerce conversion rate actually looks like
Google “average ecommerce conversion rate” and you’ll find answers ranging from 1.65% to 3.3%. That’s not a rounding error. That’s a completely different picture depending on which article you read.
Why the confusion? Different sources measure different groups of stores, over different time periods, using different methods. IRP Commerce tracks UK-heavy retailers and reports 1.65%. Dynamic Yield measures 400+ global brands and reports 2.79%. Adobe’s data says 3.3%. They’re all “correct” for their specific dataset.
The useful answer is industry-specific benchmarks. Here’s what Dynamic Yield’s rolling data shows across 200 million monthly sessions:
| Industry | Avg. conversion rate |
|---|---|
| Food & beverage | 6.0% |
| Beauty & skincare | 4.2% |
| Pet care | 3.7% |
| Fashion & apparel | 2.9% |
| Home & furniture | 1.3% |
| Luxury goods | 0.9% |
There’s also a big gap between desktop and mobile. Desktop visitors convert at roughly 3.9% to 4.3%. Mobile visitors convert at about 2.2% to 2.8%, nearly half the rate. Since mobile accounts for over 60% of all ecommerce traffic, that gap matters a lot.
To find your own rate, check your ecommerce conversion rate in Google Analytics. You can also pull your GA4 conversion rate report. If you don’t know your number, that’s the first step. You can’t improve what you don’t measure. For broader context, see our guide to what counts as a good conversion rate across all industries.
Our take: Stop comparing yourself to “the average.” A luxury furniture store at 1.5% is crushing it. A food delivery store at 1.5% has a problem. Find your industry benchmark, then aim to beat it by a point.
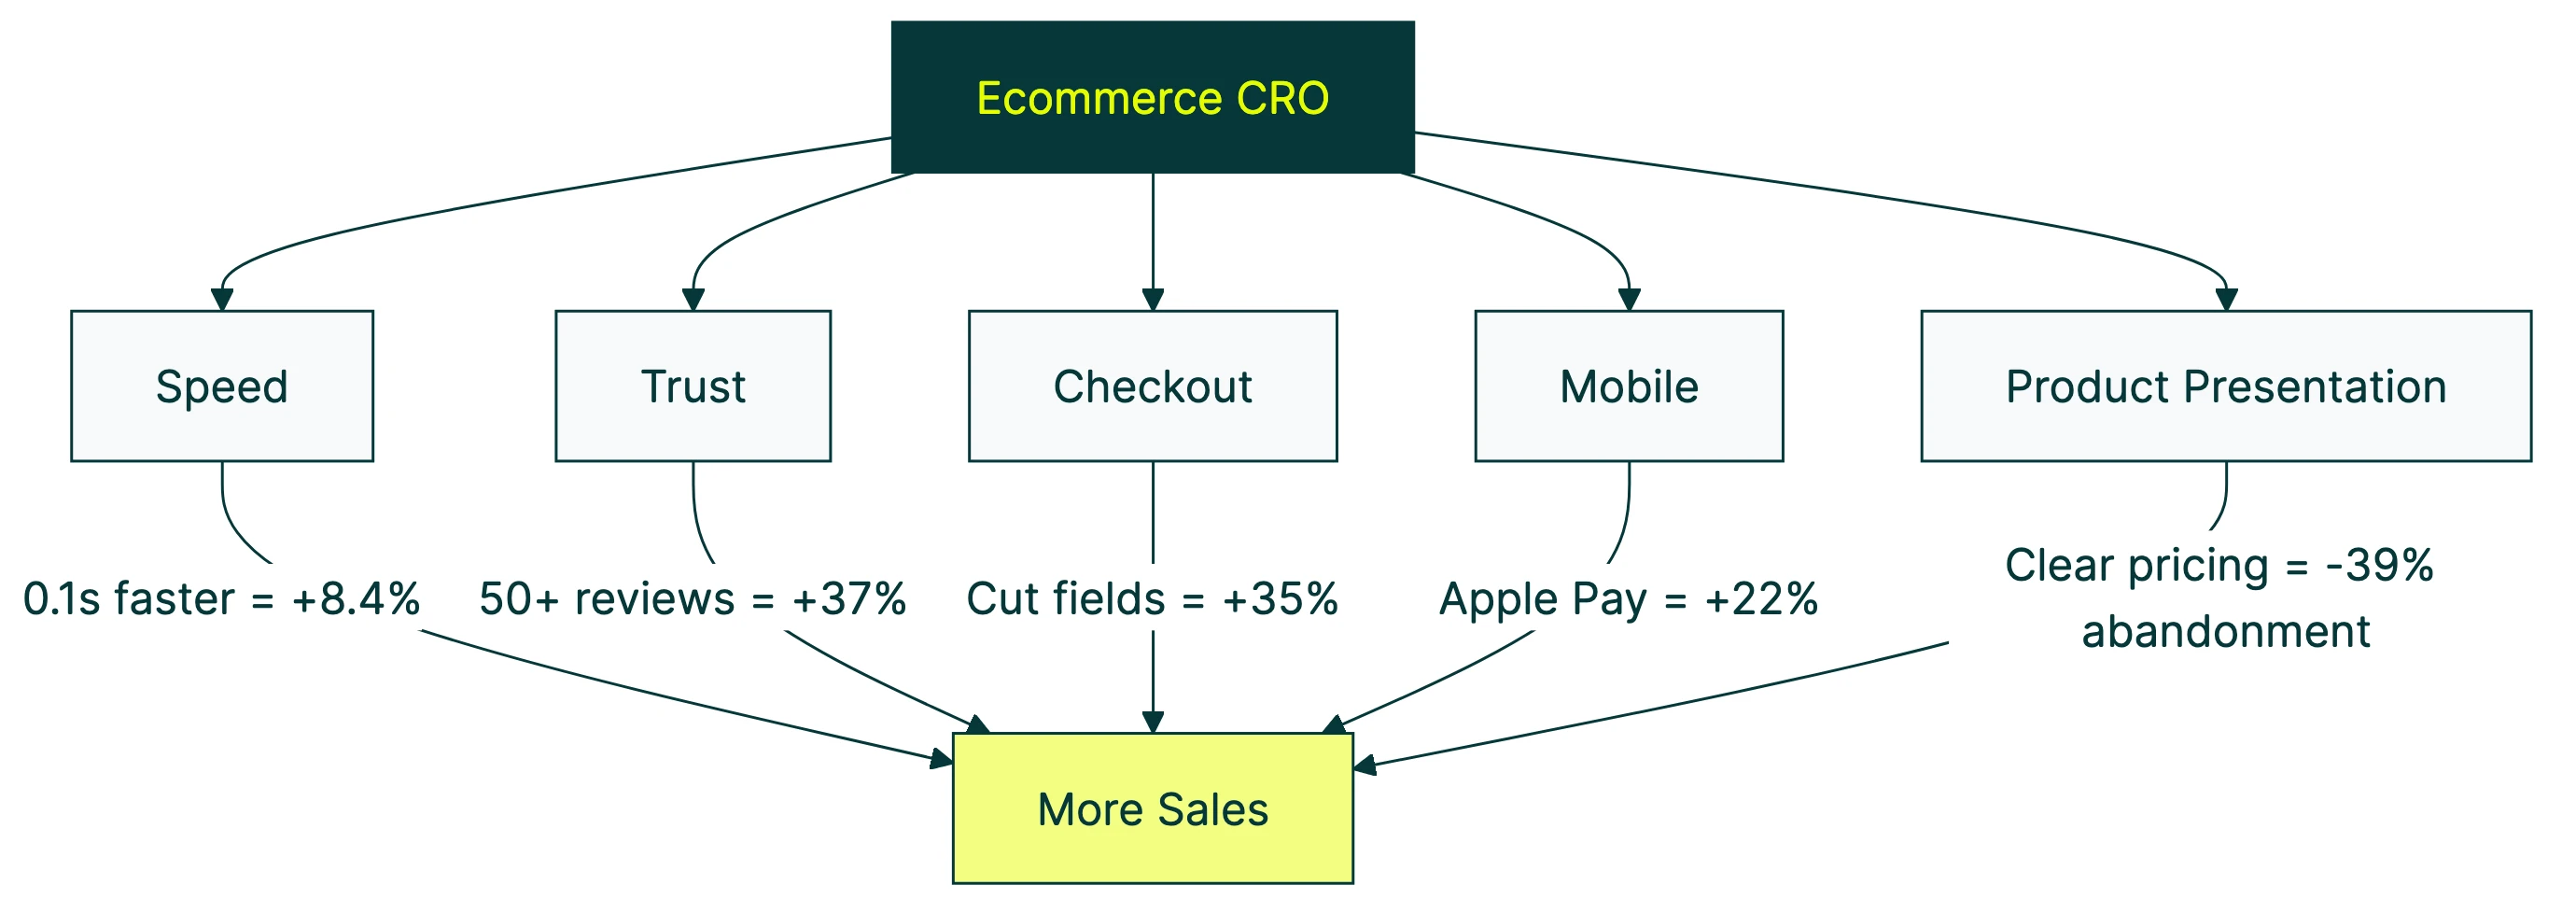
The five levers of ecommerce conversion optimization
These aren’t a checklist. They’re a mental model. Every conversion problem in ecommerce traces back to one of these five areas. Some conversion optimization tips for each one.
1. Page speed
Slow pages kill sales. A Deloitte/Google study looked at 37 retail sites and 30 million sessions. Making a page just 0.1 seconds faster increased conversions by 8.4% and order value by 9.2%. One-tenth of a second. Your visitors won’t consciously notice, but their wallets will.
2. Trust and credibility
People won’t buy from a store they don’t trust. Reviews matter most. Products with 50+ reviews convert about 37% higher than products with none. Security badges, clear return policies, and visible contact info all help. They reduce the anxiety of buying from a store you’ve never heard of.
3. Checkout friction
The average online checkout asks for 23 form fields. The ideal number is 12 to 14. Baymard Institute found that better checkout design alone could lift conversions by 35%. That represents $260 billion in recoverable lost orders across the US and EU. That’s a lot of money left in half-filled forms. To optimize your checkout process, see our dedicated guide, and for specific checkout page design tips, we have a focused companion post.
4. Mobile experience
Over 60% of ecommerce traffic comes from phones. But mobile checkout takes about 40% longer than desktop. That gap is where you’re losing mobile buyers. One-click payment options (Apple Pay, Google Pay, Shop Pay) are closing this gap. About 54% of top mobile stores now offer them. If you’re on Shopify, our guide on how to increase Shopify conversions covers specific fixes, and our broader Shopify CRO guide covers the platform-specific strategy that closes the mobile conversion gap fastest. For platform-specific CRO for Magento, WooCommerce, and BigCommerce, we have a separate guide covering the optimization tactics unique to each platform.
5. Product presentation
If visitors can’t quickly understand what they’re buying, they leave. Clear descriptions, quality images, and transparent pricing are the bare minimum. Unexpected fees are the number one reason people abandon their cart (39% of the time, according to Baymard). Show the full price early. Surprises at checkout are conversion killers.
For the full page-by-page breakdown with specific test ideas for each lever, see our ecommerce CRO checklist.
Ecommerce checkout conversion rate optimization
Checkout deserves its own section because it’s where the most money gets left on the table. The average cart abandonment rate is 70.22%, based on Baymard’s meta-analysis of 50 studies. Seven out of ten people who were interested enough to add a product to their cart still didn’t buy.
Why? Baymard’s research breaks it down:
- 39% abandoned because of unexpected costs (shipping, taxes, fees)
- 19% were forced to create an account
- 18% said the checkout was too long or complicated
- 15% hit website errors or crashes
The fix for the first one is easy in principle: show all costs upfront. Don’t hide shipping fees until the last screen. The customer feels tricked, and tricked customers close tabs.
The account creation question has a real tradeoff, though. Forcing people to register costs you 19 to 26% of shoppers who would have bought. But registered customers convert at 64% on repeat visits, compared to 52% for guests. The smart move is to offer guest checkout first, then ask for an account after the purchase is complete. You get the sale now and the relationship later.
And those 23 form fields we mentioned? Cut them. Every field you remove reduces friction. Name, email, address, payment. That’s really all you need. If your checkout feels harder than buying from Amazon, your visitors will just go buy from Amazon instead.
How to know if you’re ready for conversion optimization
VWO and Speero’s 2024 report found that only about 11.5% of the top million websites run an A/B testing tool. That means roughly 88% of ecommerce stores have never run a structured test.
Most CRO content skips this part. It jumps straight to “run A/B tests” without asking whether you’re ready for that. So here’s a maturity assessment. Figure out where you are, then do the right thing for that level.
Level 1: Fix the basics. You haven’t looked at your analytics in a while. Your site might be slow on mobile. You might not offer guest checkout. Start there. No testing tool needed. Just fix the obvious stuff.
Level 2: Understand your data. You know your conversion rate and where visitors drop off. Run a CRO audit to find the biggest leaks. If you’re running an online store, our ecommerce CRO audit checklist walks through the process page by page. Look at your landing page performance. You’re building the picture of what’s wrong before you start testing fixes.
Level 3: Start testing. You get at least 1,000 monthly visitors to your key pages. You’ve fixed the basics. Now you can run meaningful tests. This is where a simple A/B testing tool like Kirro helps. You pick a page, change something (a headline, a button, an image), and see which version gets more sales. No developer needed. No statistics degree required.
Level 4: Systematic testing. You run CRO tests regularly, document what you learn, and build on results. You have a CRO strategy that connects testing to business goals.
CRO expert Peep Laja puts it well: spend 80% of your effort on research, 20% on testing. Most stores invert that ratio. They jump to testing before understanding the problem. That’s why only about 1 in 8 A/B tests produces a winner. Not a failure of testing. A failure of preparation.
Our take: Don’t spend $300/month on a testing tool when your site takes 5 seconds to load on mobile. Fix the free stuff first. When you’re ready to test, start with a free trial and test the one page that gets the most traffic.
Common mistakes that kill ecommerce conversions
Testing too early. If your page gets 200 visitors a month, an A/B test will take six months to produce a reliable result. At that point, the data is so old it might not even be relevant. Get your traffic up first, or focus on bigger changes you can evaluate with simpler methods.
Copying competitors blindly. Your competitor added a countdown timer? That doesn’t mean you should. You don’t know if it’s working for them. You don’t know if their audience is the same as yours. Steal ideas, but test them. What works for a $50 t-shirt store might fail for a $5,000 furniture store.
Ignoring traffic quality. A 3% conversion rate from Google search is not the same as 3% from TikTok ads. Search visitors already want what you sell. Social visitors are browsing. If your conversion rate drops after launching a new ad campaign, it might not be your store. It might be the traffic.
Chasing pretty over useful. Amazon isn’t winning any design awards. It converts like crazy because it’s fast, clear, and removes every barrier to buying. A gorgeous redesign that confuses visitors is worse than an ugly page that works.
Measuring the wrong thing. Page views are not conversions. Time on site is not revenue. Click conversion rate might look great while actual purchases stay flat. Track what matters: purchases, revenue per visitor, and cart abandonment rate.
FAQ
What is ecommerce conversion optimization?
Ecommerce conversion optimization is the process of changing your online store so more visitors complete a purchase. It covers everything from how fast your pages load to how many fields your checkout form has. Unlike general marketing (which focuses on getting more visitors), conversion optimization focuses on the visitors you already have. The goal: same traffic, more sales.
How do you improve ecommerce conversion rates?
Start by knowing your numbers. Check your conversion rate in GA4, your cart abandonment rate, and your top exit pages. Fix obvious friction first (page speed, guest checkout, mobile experience). Then move to testing. Change one thing at a time and measure whether it improves sales. The five levers covered above (speed, trust, checkout, mobile, product presentation) are where most stores find their biggest wins.
What is a good ecommerce conversion rate?
It depends entirely on your industry. Food and beverage stores average 6%. Fashion averages 2.9%. Luxury goods average under 1%. The global average across all ecommerce is roughly 1.65% to 2.8%, depending on which data source you use. If you’re above your industry average, you’re doing well. If you’re below, there’s probably low-hanging fruit to fix. For full benchmarks across all industries (not just ecommerce), see what counts as a good conversion rate.
How do you improve checkout conversion?
Cut form fields from the typical 23 down to 12 or 14. Offer guest checkout (forcing account creation loses you 19% to 26% of buyers). Show all costs, including shipping, on the product page or cart page, not at the last step. Add trust signals like security badges and a visible return policy. And offer one-click payment options like Apple Pay or Google Pay, especially on mobile where checkout takes 40% longer.
Do I need an A/B testing tool for ecommerce CRO?
Not right away. If your store gets fewer than 1,000 monthly visitors to a key page, focus on fixing obvious issues first. Page speed, mobile checkout, unexpected fees. These don’t need a test because they’re best practices. Once the basics are solid and you have enough traffic, a testing tool helps you decide with data instead of guessing. Kirro is built for exactly this. Simple A/B testing for stores that want to stop guessing without paying enterprise prices.

Randy Wattilete
CRO expert and founder with nearly a decade running conversion experiments for companies from early-stage startups to global brands. Built programs for Nestlé, felyx, and Storytel. Founder of Kirro (A/B testing).
View all author posts