What “conversion rate” means in GA4 (and why Google renamed it)
Your GA4 conversion rate is the percentage of visits (or visitors) who did the thing you care about. (Quick shortcut: the conversion rate calculator does the math for you.) A purchase, a signup, a form submission. That’s it. Sessions where the thing happened, divided by total sessions, times 100. It’s one of the most important numbers in conversion rate optimization and funnel analytics.
But Google made this harder to find than it needed to be.
In March 2024, Google renamed “conversions” to “key events” inside GA4. No big announcement. Just quiet help page updates and a few emails that most people missed. The metric you’re looking for is now called session key event rate or user key event rate. Depends on how you want to count.
Why the rename? Because Google wanted to separate GA4 analytics language from Google Ads language. So now a purchase is a “key event” in your GA4 reports. But the same purchase is a “conversion” in Google Ads. Same event. Same data. Two names. One practitioner put it perfectly: “So a purchase from a Facebook ad will be a key event, but the same purchase from a Google ad will be a conversion?”
Yeah. That’s exactly what happened.
If you’re tracking ecommerce conversion rate in Google Analytics specifically, we’ve got a separate guide for that. For lead gen teams, our guide on measuring lead conversion rates covers which events to track at each funnel stage. This post covers GA4 conversion rate for everyone: SaaS signups, lead forms, downloads, any action you’re measuring.
Our take: The rename confused everyone and helped nobody. But the metric underneath is still useful. Don’t let Google’s naming choices scare you off.
Session key event rate vs user key event rate
GA4 gives you two ways to measure your Google Analytics conversion rate. They sound similar. They’re not.
Session key event rate answers: “What percentage of visits resulted in the action?” Say someone visits your site 100 times. Three of those visits include a purchase. Your session rate is 3%.
User key event rate answers: “What percentage of people eventually did the action?” If 100 different people visited and 3 of them purchased (even across multiple visits), your user rate is 3%.
Quick example. Sarah visits your site 3 times. She browses on Monday, browses again Wednesday, and buys on Friday. Her session key event rate is 33% (1 converting visit out of 3). Her user key event rate is 100% (she eventually bought).
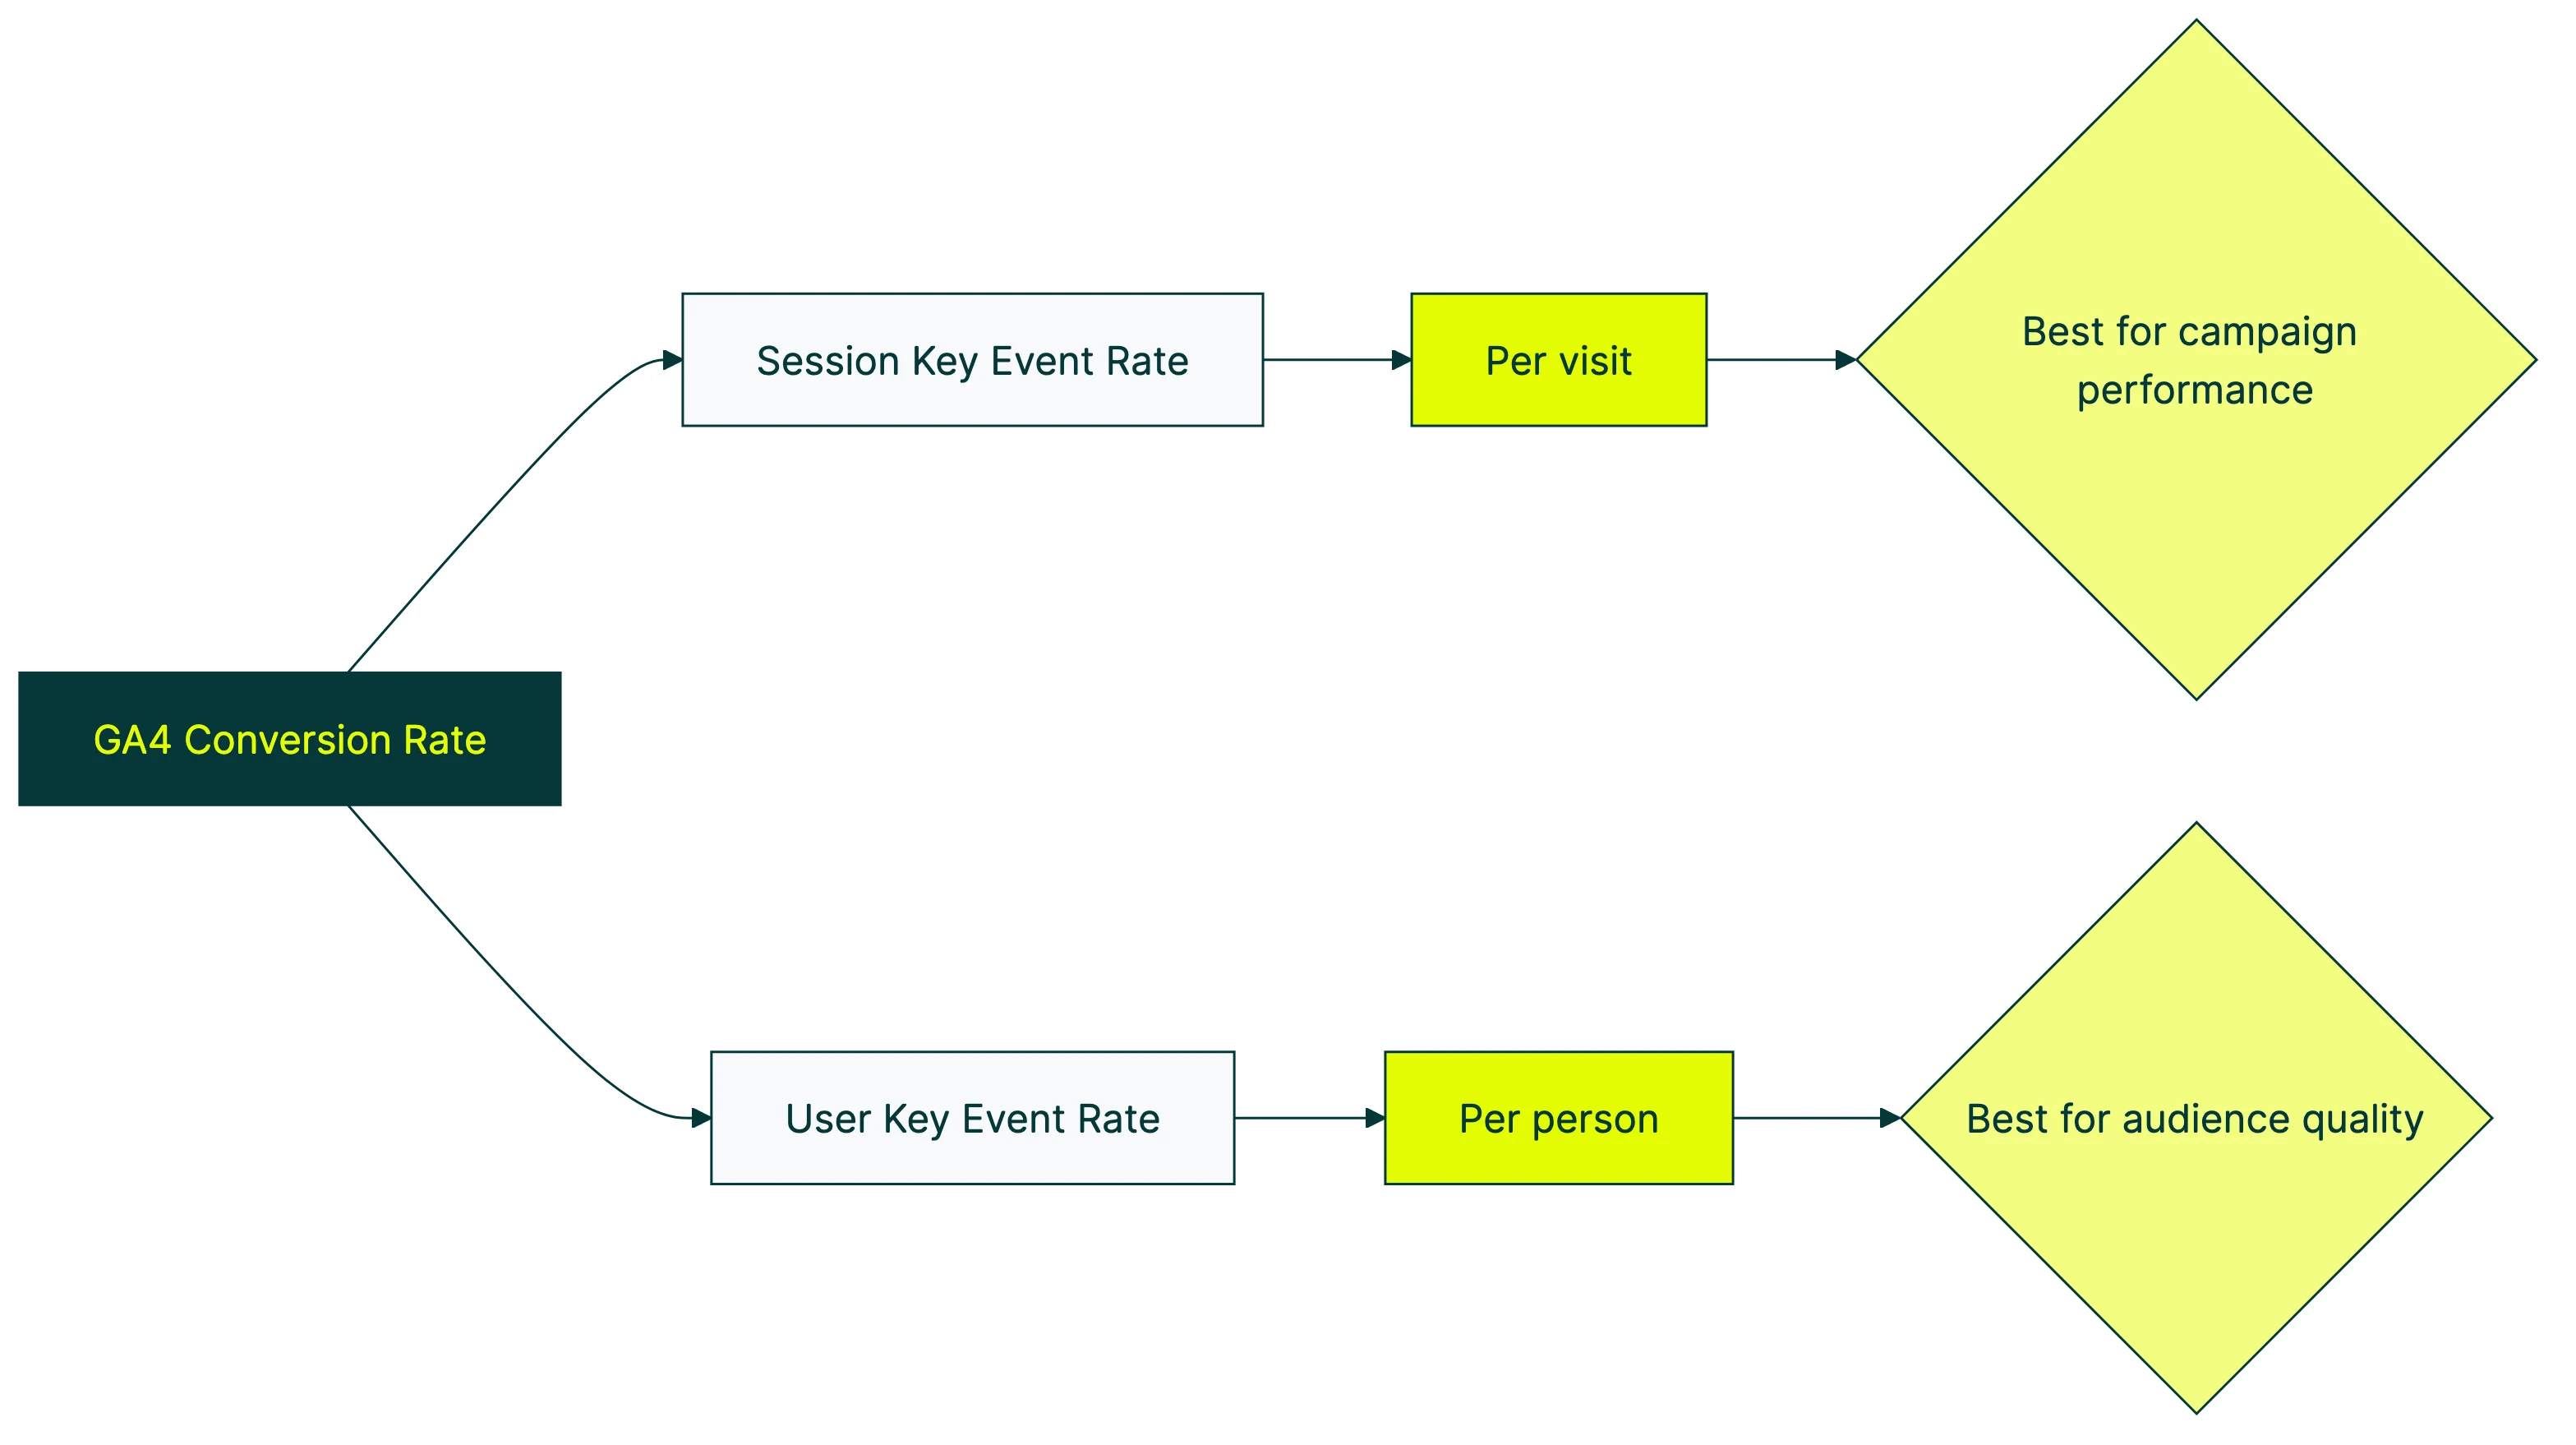
| Session key event rate | User key event rate | |
|---|---|---|
| What it counts | Per visit | Per person |
| Sarah’s rate | 33% (1 of 3 visits) | 100% (she bought) |
| Best for | Campaign performance | Audience quality |
| Analogy | Foot traffic to sales ratio | What % of your customers ever buy |
When to use which: Session rate for judging campaign performance (is this traffic source converting?). User rate for understanding audience quality (are the right people finding us?). If you want to go deeper on picking the right metrics, check out our guide to CRO metrics that matter.
For a visual walkthrough of how to find and use these metrics in GA4, MeasureSchool breaks it down step by step:
The “double counting” trap
This trips up almost everyone. And even some analytics sites get it wrong.
Say a visitor triggers 3 purchase events in one session (3 items bought separately). GA4 counts that as 3 key events but only 1 converted session. Pull up your raw data and divide the Conversions column by Sessions. You’ll get a different number than what GA4 shows as “session key event rate.”
That’s because GA4 counts sessions where at least one key event happened, divided by total sessions. Not total key events divided by total sessions. The difference matters if you’re building reports or exporting data. Always use the built-in session key event rate metric instead of doing the math yourself.
If you want to learn the underlying formula, we’ve got a full breakdown at how to calculate conversion rate. And if you’re trying to figure out which specific goals to track as key events, our goal conversion rate guide covers how to build a goal hierarchy.
How to find your conversion rate in GA4
Method 1: standard reports (the quick answer)
This is the fastest way to see your conversion rate in Google Analytics. If you want to check a specific campaign’s number without pulling up a full report, our conversion rate calculator for marketing lets you run the math directly.
- Open GA4. Go to Reports → Acquisition → Traffic acquisition
- Click the pencil icon in the top right to customize
- Click Metrics, then add “Session key event rate”
- Pick your event from the dropdown (purchase, sign_up, whatever you’re tracking)
- Save
You’ll see your Google Analytics conversion rate broken down by traffic source. Organic, paid, social, email, all in one view.
Quick note: this option wasn’t available in standard reports until late 2023. A lot of older guides still say you need to build an exploration. You don’t. Not for the basics.
Method 2: explorations (the deep answer)
Standard reports give you the top-level number. Explorations let you slice it however you want.
- Go to Explore → Blank exploration
- Add dimensions: Session source/medium (or Landing page, Device category)
- Add metrics: Sessions, Session key event rate
- Drag them into the report
- Add a filter for your specific key event
Why bother? Because explorations let you break conversion rate down by landing page, device, campaign, and combinations of all three. Standard reports don’t do that. When you’re ready to analyze your full funnel step by step, explorations are the tool you’ll use.
Start with standard reports. Move to explorations when you need to know why a number is what it is.
Why your GA4 conversion rate looks different from Universal Analytics
If you migrated from Universal Analytics (the old version of Google Analytics) and your conversion rate analytics look off, you’re not imagining things. The counting rules changed.
GA4 counts sessions differently. Universal Analytics restarted a session at midnight. It also started a new session when someone arrived from a different traffic source. GA4 doesn’t do either. A visitor browsing from 11:55 PM to 12:05 AM? One session in GA4, two in UA.
Fewer sessions means a smaller denominator. Same conversions divided by fewer sessions = a higher rate. This is counter-intuitive because most people assume GA4 always shows lower numbers than UA. That’s not true. In some scenarios, GA4 shows higher conversion rates.
The formula changed too. UA’s ecommerce rate was Transactions ÷ Sessions. If someone made 3 purchases in one session, that counted as 3 transactions. Your rate could exceed 100%. GA4 caps session key event rate at 100% per session. It measures “did a key event happen?” not “how many happened?”
GA4 undercounts compared to Google Ads. Bidnamic found GA4 tracks about 15% fewer conversions than the old system. The gap with Google Ads’ own pixel is even wider, up to 40%. Why? Ad blockers, Safari’s tracking protection, and consent settings all block GA4’s script from firing. Google Ads’ pixel dodges most of that.
So if your GA4 number doesn’t match your Google Ads dashboard, that’s normal. Gaps of 15-40% are common. The numbers aren’t wrong. They’re just measuring from different angles. For a full breakdown of how click conversion rate differs from GA4, see our dedicated guide.
Our take: If your GA4 rate looks weird compared to your old UA number, it’s probably right. The calculation changed, not your business performance. Stop comparing the two and work with what GA4 gives you.
5 custom GA4 reports every marketer needs
The default GA4 view is fine for a quick pulse check. But these five reports turn your analytics into something you can actually act on.
Report 1: conversion rate by traffic source
What it answers: Which channels actually convert?
Build a free-form exploration with Session source/medium as your dimension and Session key event rate as your metric. Sort by sessions (highest first) so you’re looking at channels with real volume.
This is usually where the surprises live. That social campaign getting tons of clicks? Check whether any of those clicks convert. Often they don’t.
Report 2: conversion rate by landing page
What it answers: Which pages earn their traffic?
Same setup, but use Landing page as your dimension instead. This shows you where the biggest improvement opportunities are. If you’re tracking conversion funnels, this is the first thing to check.
Find your highest-traffic page with the lowest conversion rate. That’s your starting point for testing. Fix one underperforming page and you’ll move the needle more than tweaking ten pages that barely get traffic.
When you find that page, set up a quick A/B test with Kirro. Test a new headline or layout. Kirro picks up your GA4 events automatically. No extra tracking setup. You just see which version moves the number.
Report 3: conversion rate by device
Add Device category as your dimension. Almost every site we’ve seen has a lower mobile conversion rate. The question is how much lower. Desktop at 4% and mobile at 0.8%? That’s a mobile problem. Desktop at 4% and mobile at 3%? You’re fine.
Report 4: conversion rate over time
Use a line chart exploration with Date as your dimension. This trend line is your honest report card. No vanity metrics. Just “are more of my visitors doing the thing I want them to do?”
Report 5: conversion rate by new vs returning visitors
The first-impression test.
Add User type (new vs returning) as your dimension. Returning visitors almost always convert at higher rates. But if the gap between new and returning is massive, your landing pages might not be doing their job for first-time visitors.
GA4 also supports calculated metrics now if you want to build custom rate definitions. But for most teams, these five standard reports cover what you need.
Common GA4 conversion tracking mistakes (and how to fix them)
Practitioner audit data suggests roughly 40% of GA4 properties have misconfigured events. That’s a lot of teams making decisions on bad data.
Not marking events as key events. Your event fires. GA4 sees it. But without the key event toggle flipped, GA4 ignores it in conversion rate calculations. The event just sits there, invisible. Go to Admin → Events and check your important actions are toggled on.
Case sensitivity. GA4 treats add_to_cart and Add_To_Cart as two different events. If your tag manager sends one capitalization and your website sends another, you’ll have split data and incomplete numbers.
Duplicate tracking from auto-migration. When Google migrated UA goals to GA4 automatically, it created GA4 events. If you also set up events manually, you might be counting the same action twice. Your raw conversion count will be inflated, which makes everything downstream unreliable.
Not filtering internal traffic. Every time you or your team visits the site, that’s a session in the denominator that was never going to convert. More sessions without conversions = lower conversion rate. Set up an internal traffic filter in Admin → Data Streams → Configure tag settings.
Hitting the 30 key event limit. GA4 caps you at 30 key events per property. Mark page scrolls, video plays, and outbound clicks as key events? You’ll burn through slots fast. Save them for the actions that actually matter. Our guide to running a CRO audit helps you figure out which ones those are.
How to actually improve your GA4 conversion rate
Knowing your conversion rate is step one. Improving it is where the work happens.
Step 1: Segment before you do anything. Your aggregate conversion rate is meaningless. A 2% overall rate? That hides email converting at 8% and social at 0.3%. Break it down by source, page, and device first. That’s what conversion rate optimization is actually about. Understanding your conversion funnel stages helps you see exactly which step in the journey each segment struggles with. Our guide to key conversion rate metrics covers which segmented rates are worth watching and which ones are noise.
Step 2: Find your worst-performing high-traffic page. Pull up Report 2 from above (conversion rate by landing page). Sort by traffic. Find the page that gets the most visits but converts the worst. That’s your biggest opportunity. A page going from 0.5% to 1% at 10,000 visits per month? That’s 50 extra conversions. A page going from 2% to 4% at 200 visits? Four extra. Math wins.
Step 3: Test one change on that page. Don’t redesign the whole thing. Test one element. A new headline. A different call-to-action. A shorter form. A/B testing your conversion rate on a single page gives you cleaner data than changing everything at once.
You can set up a test in about three minutes. Change the headline, split traffic, and let the numbers tell you what works.
Step 4: Match the metric to the question. Session key event rate for campaign performance. User key event rate for audience quality. Mixing them up leads to bad decisions. For benchmarks by industry, check what is a good conversion rate.
Connect your GA4 data with Kirro to see how test versions affect your actual conversion rate. No extra tracking code. Kirro reads the GA4 events you’re already collecting. It shows you which version of your page actually moved the number.
If you want to go deeper on CRO testing methods or explore Google Optimize alternatives now that Optimize is gone, those guides walk through the full picture.
FAQ
Where is conversion rate in GA4?
It’s called “session key event rate” or “user key event rate” now. Google renamed conversions to “key events” in March 2024, so the rate metric got renamed too. Find it in Reports → Traffic acquisition (click the pencil icon to add the metric) or build a custom exploration. The metric works the same way it always did. Only the name changed.
Why is my GA4 conversion rate different from Universal Analytics?
Different session counting rules and a different formula. UA restarted sessions at midnight and on source changes. GA4 doesn’t. GA4 often counts fewer total sessions. That can push your rate higher or lower depending on your traffic. The metric changed. Your business performance probably didn’t.
What is a good conversion rate in GA4?
Depends on what you’re measuring and who’s visiting. Ecommerce purchase rates average 1.5-3%. SaaS free trial signups run 3-8%. Lead gen forms typically see 2-5%. But these aggregate numbers hide huge variation by traffic source, device, and industry. A segmented rate by channel is worth ten times more than one overall number. Check our full breakdown at what is a good conversion rate.
What is the difference between session key event rate and user key event rate?
Session rate counts per visit. User rate counts per person. A visitor who comes 5 times and buys once has a 20% session rate but a 100% user rate. User rate is almost always higher because one converting visit out of many still counts the person as converted. Use session rate for campaign analysis, user rate for audience quality.
Why doesn’t my conversion rate in GA4 match Google Ads?
GA4 uses “key events” while Google Ads uses “conversions.” Different counting windows. Different attribution models (how they assign credit to touchpoints). And GA4 gets blocked by ad blockers and browser privacy features that Google Ads’ pixel mostly avoids. Gaps of 15-40% are normal. Neither is “wrong.”

Randy Wattilete
CRO expert and founder with nearly a decade running conversion experiments for companies from early-stage startups to global brands. Built programs for Nestlé, felyx, and Storytel. Founder of Kirro (A/B testing).
View all author posts