Funnel analysis is the process of measuring how many people complete each step of your customer journey, then figuring out where (and why) they leave. Your overall conversion rate is a single number. Funnel analysis breaks that number into stages so you can actually do something about it.
Here’s why that matters. A 3% conversion rate could mean everyone drops off evenly across your site. Or it could mean 90% of people bail at checkout. Same number. Very different problems. Very different fixes.
And the fixes are worth finding. Contentsquare analyzed 99 billion website sessions in 2026 and found conversion rates dropped 5.1% year over year. People are harder to convert than they were last year. If you’re not analyzing your funnel, your conversion rate optimization is just guessing where the money leaks. Probably guessing wrong.
If you need a refresher on what a conversion funnel actually is, start there. This post assumes you already have one. We’re here to take it apart and see what’s broken.
What funnel analysis tells you (that your overall conversion rate doesn’t)
Your conversion rate is an average. Averages are lazy. They hide the interesting stuff.
Say your online store converts at 2.5%. That sounds okay. But break it into stages and you might see this:
- Homepage to product page: 60% continue
- Product page to add-to-cart: 35% continue
- Add-to-cart to checkout: 70% continue
- Checkout to purchase: 30% complete
That checkout step is brutal. Seven out of ten people who start paying you money change their mind. That’s not a “conversion rate problem.” That’s a checkout problem.
Without funnel analysis, you’d be guessing. Maybe you’d redesign the homepage. Maybe you’d rewrite product descriptions. Both are fine ideas, but neither fixes the real bottleneck.
This is the difference between CRO metrics that look nice in a report and metrics that actually help you make decisions. Funnel analysis gives you the second kind.
Our take: If you only track one CRO number, your overall conversion rate is fine. But it’s like checking your car’s “check engine” light. It tells you something’s wrong. It doesn’t tell you what. Funnel analysis opens the hood.
Understanding where people leave is the first step of any serious CRO audit. And it’s the foundation of conversion rate optimization that actually moves revenue, not just metrics.
How to set up your funnel for analysis
Before you analyze anything, you need to define what your funnel looks like. The classic marketing funnel (Awareness, Interest, Desire, Action) is a nice mental model. But your actual data needs real steps that people take on your site.
Keep it to 4 to 8 steps. Fewer than that and you won’t see enough detail. More than that and the data gets noisy.
Here are templates by business type:
Ecommerce: Visit → Product page → Add to cart → Checkout → Purchase
Track your ecommerce conversion rate in Google Analytics to see how these stages perform over time.
SaaS: Visit → Signup → Activation (first key action) → Paid conversion
SaaS free trials convert at about 17% on average. Freemium models sit around 5% (OpenView 2023 benchmarks, 1,000 SaaS companies surveyed). Below those numbers? Funnel analysis tells you which stage to fix.
Lead gen: Visit → Form start → Form submit → Qualified lead → Closed deal
For benchmarks at each stage, see lead generation conversion rates for your industry.
Pick your tool
For most small businesses, GA4’s built-in funnel report is enough to start. It’s free and it works. If you need deeper behavioral analysis (like tracking individual actions within a step), tools like Amplitude or Mixpanel are better. We’ll walk through the GA4 setup in a later section.
Set your conversion window
This is the part nobody talks about. If someone visits your site Monday but buys Thursday, does that count as one journey? Or two separate visits?
Your conversion window is the timeframe you use to connect steps. GA4 defaults to 30 days. Amplitude lets you customize it.
The right window depends on your business. A coffee shop might use 24 hours. A B2B company selling enterprise software? Probably 90 days. Forrester found the median B2B buying cycle is 11.3 months.
Pick the wrong window and your numbers lie. Too short, and you miss people who take time to decide. Too long, and you connect visits that have nothing to do with each other.
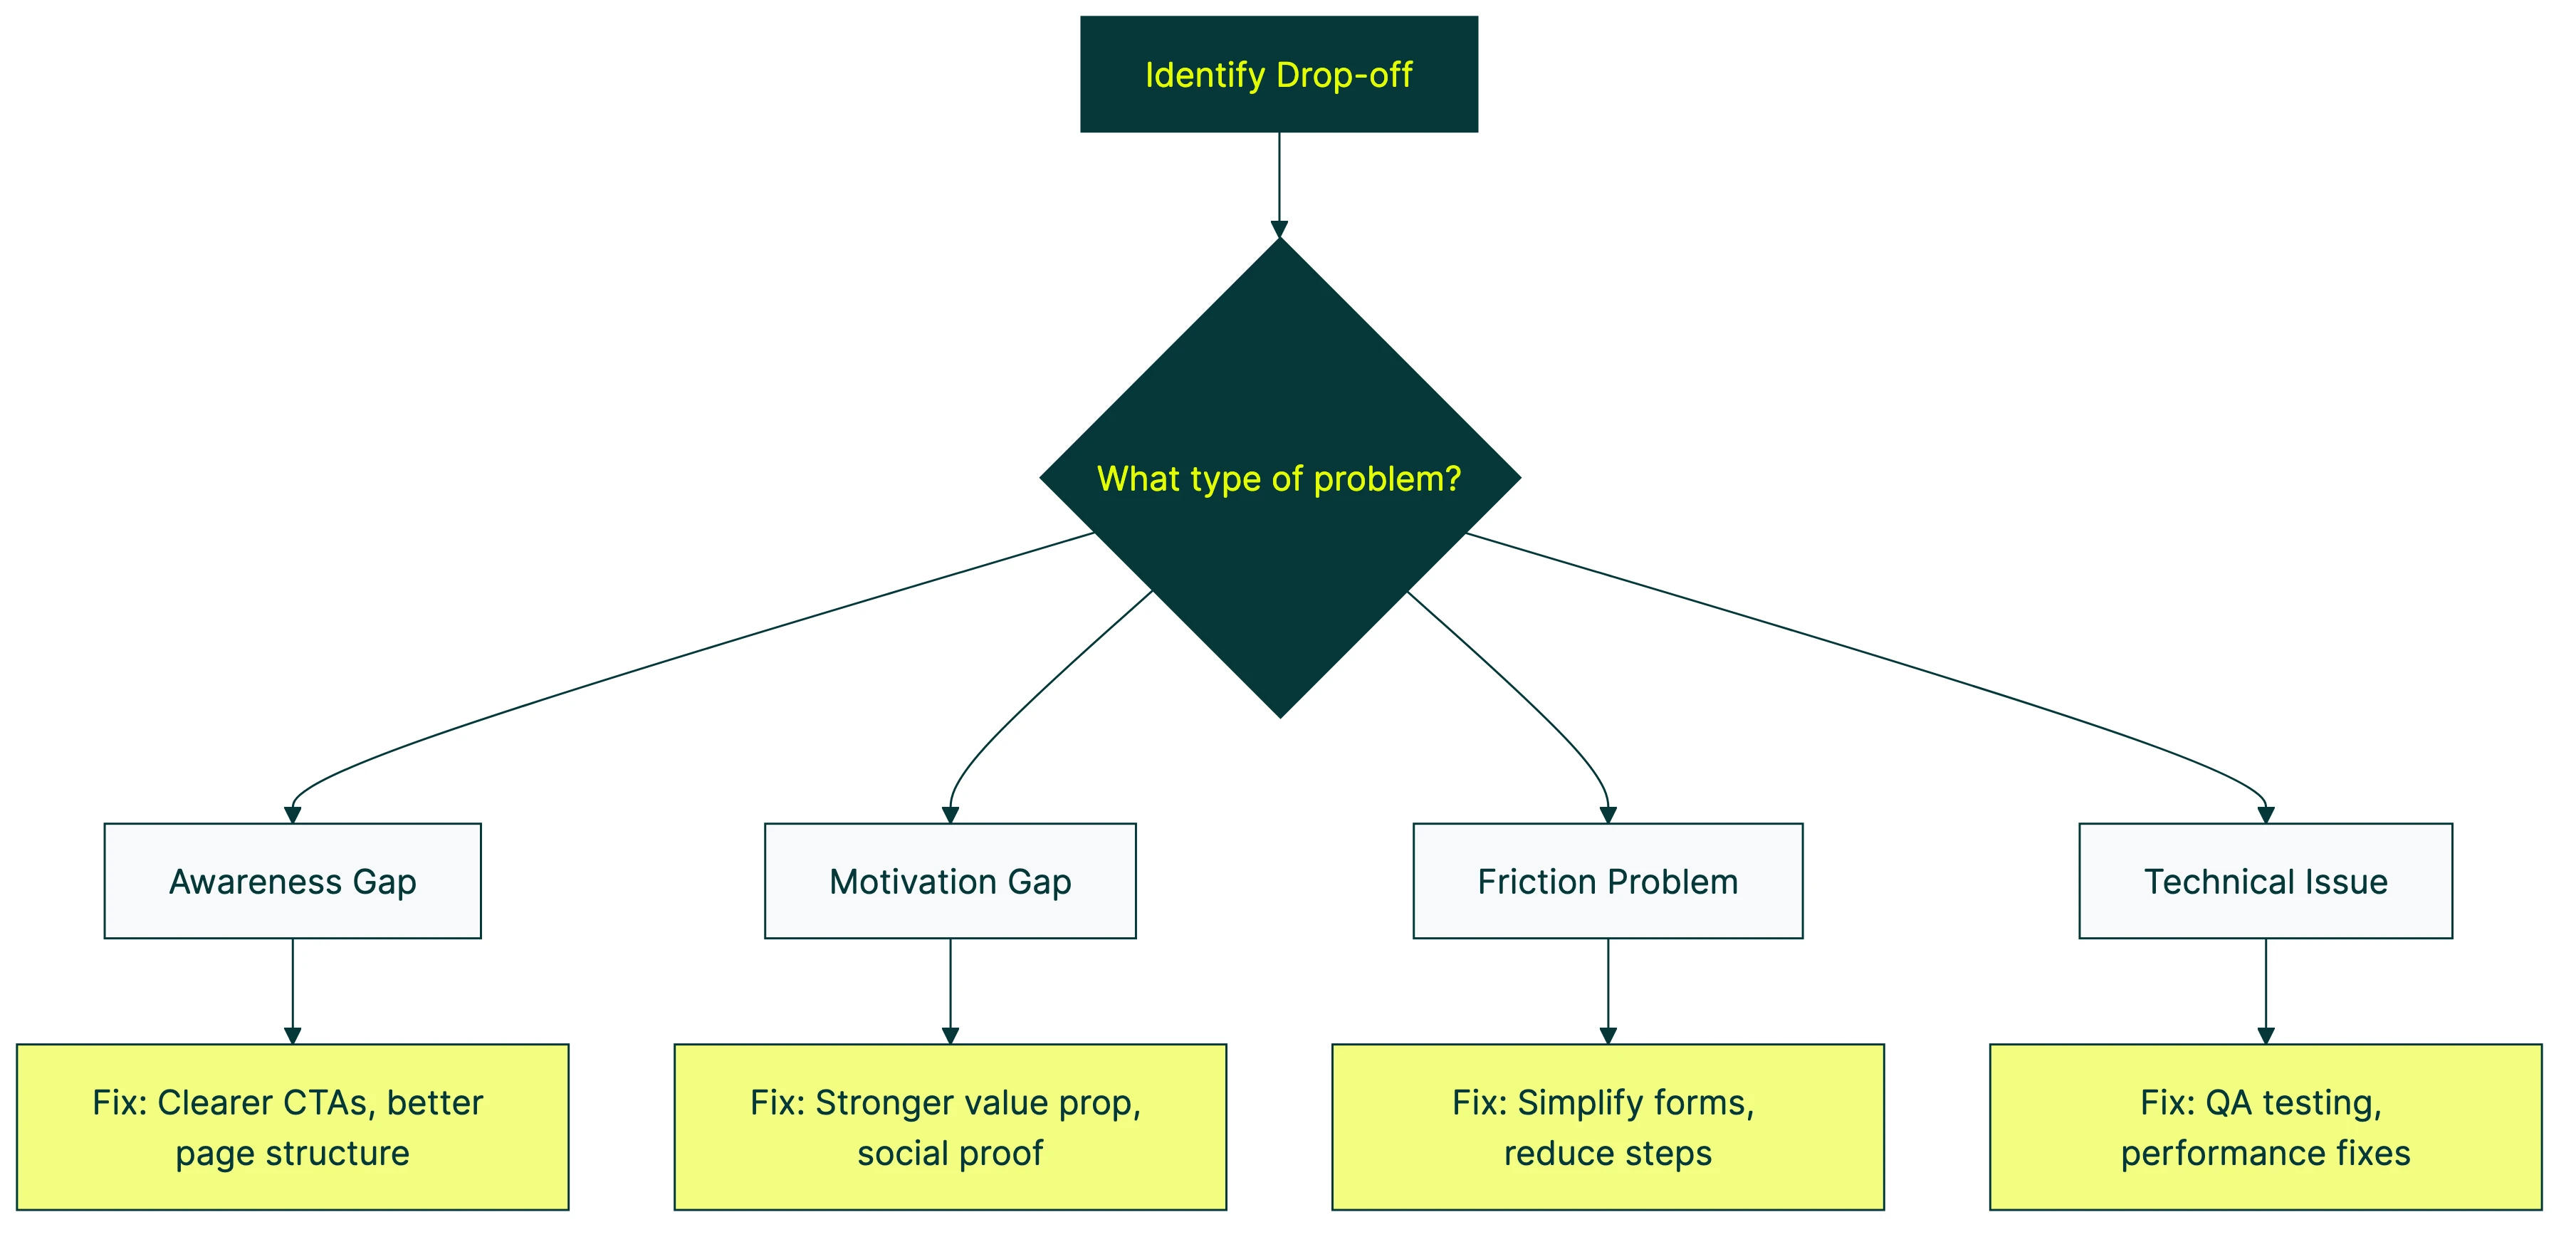
The 4-category diagnostic framework: why people drop off
Most funnel analysis guides stop here: “Find the biggest drop-off. Fix it.” That’s like a doctor saying “Find the biggest symptom. Treat it.” Without a diagnosis, you might prescribe painkillers for a broken bone.
Drop-offs happen for different reasons. Each reason needs a different fix. Here’s a framework we use to sort them into four categories.
1. Awareness gaps
They don’t know what to do next. Your page doesn’t make the next step obvious.
Signals: High exit rate on pages that should lead somewhere. Short time on page. Low scroll depth. People land, look around, and leave.
Real-world version: Imagine walking into a store where the checkout counter is hidden in the back corner. You want to buy something. You just can’t figure out how.
Fix direction: Clearer calls to action, better page structure, visible next steps. If your landing page doesn’t make the next action obvious within 3 seconds, that’s an awareness gap.
2. Motivation gaps
They know what to do. They just don’t want to.
Signals: High bounce on pricing pages or product pages. People comparing your page to competitors (short visits, then leaving). They understand the offer. They’re not sold.
Fix direction: Stronger value proposition. Social proof (reviews, logos, numbers). Urgency where it’s honest. And sometimes, fewer options. Iyengar and Lepper’s choice overload study found that 24 jam flavors dropped purchase rates to 3%. Six flavors? 30% bought. Motivation gaps aren’t always about giving people too little. Sometimes you’re giving them too much.
3. Friction problems
They want to act. Something blocks them.
Signals: Form abandonment. Checkout drop-off. Unusually long time on a single step (they’re struggling, not reading). Baymard Institute found that 18% of online shoppers abandon checkout because the process is too long or complicated. That’s friction. The intent was there. The form killed it.
Fix direction: Simplify forms. Reduce steps. Fix confusing error messages. Remove forced account creation. For friction problems, A/B testing is the fastest way to validate fixes. Test a shorter form against your current one and see what happens. Kirro makes this a five-minute setup.
4. Technical issues
The page literally doesn’t work right.
Signals: Device-specific drop-offs (works on desktop, breaks on mobile). Browser-specific issues. Error pages in the middle of your flow. Slow load times on specific steps.
Fix direction: QA testing across devices and browsers. Performance fixes. Contentsquare found that 40% of all website visits involve some form of user frustration (rage clicks, dead clicks, slow pages). Technical issues are more common than most people think.
Our take: Most funnel problems are category 2 or 3. People either aren’t motivated enough to continue, or the process itself gets in their way. Technical issues are the easiest to find and fix. Awareness gaps are the most overlooked.
Once you’ve diagnosed the problem category, you can pick the right fix and test it with CRO testing methods that match.
For a practical walkthrough of building funnel reports in GA4, Analytics Mania covers the full setup:
Step by step: running your first funnel analysis in GA4
GA4 (Google Analytics 4) includes a free tool for funnel analysis called Funnel Exploration. If you already track events in GA4, you can build a funnel in about ten minutes.
Here’s the walkthrough. We’re assuming you have GA4 set up and some data flowing in. If you need to find your conversion rate in GA4 first, do that.
Step 1: Open Funnel Exploration. Go to Explore (left sidebar) → click “Funnel exploration” from the template gallery. This creates a new blank funnel.
Step 2: Add your funnel steps. Click “Steps” in the tab settings. Add each step as an event (like page_view, add_to_cart, begin_checkout, purchase). Name each step something readable.
Step 3: Choose open or closed funnel. This is a setting most people skip, and it changes your numbers a lot.
- Closed funnel: People must complete Step 1 before Step 2 counts. This is stricter. Use it for linear flows like checkout.
- Open funnel: People can enter at any step. Use this for exploratory journeys where people don’t always start at the same place.
Most checkout funnels should be closed. Most content or browsing funnels should be open.
Step 4: Add breakdowns. This is where it gets useful. Break down your funnel by device type, traffic source, or country. You’ll see completely different conversion patterns. (More on why this matters in the next section.)
Step 5: Read the results. Each bar shows how many people made it to that step. The percentages between bars are your stage-to-stage conversion rates. The biggest percentage drop is your first place to investigate.
You can also calculate conversion rates manually if you want to cross-reference or build custom reports.
GA4’s limitations (honest take)
GA4 works. But it has quirks. BlastX analyzed GA4’s strengths and weaknesses and found it silently drops data rows when your site has too many different values for a dimension (they call this “cardinality constraints”). Translation: if you have thousands of pages or products, some of your data might just be missing.
For most small business sites, this isn’t a problem. For larger sites, tools like Amplitude or Mixpanel handle this better.
Why “fix the biggest drop-off” is dangerous advice
Every funnel analysis guide says the same thing: find the biggest drop-off and fix it first. Sounds logical. It’s also how you accidentally make things worse.
Amplitude published a case study about Rappi, a delivery app. Their team moved shipping cost information from the cart page to the checkout page. The cart-to-checkout rate went up. But overall orders dropped 5%. People who didn’t see the shipping cost until checkout abandoned at a higher rate. Improving one stage made the whole funnel worse.
Funnel stages aren’t independent. They’re connected. What people see at step 2 shapes their expectations at step 3. Seiler and Yao (2017) found this in advertising data: changes at one funnel stage don’t affect all other stages equally. Some stages absorb the impact. Others amplify it.
A better approach: prioritize by revenue
Instead of fixing the biggest percentage drop, calculate the revenue at risk for each stage.
Here’s a quick formula:
Revenue at risk = Visitors at stage × Drop-off rate × Average order value
Example: Your checkout gets 1,000 visitors per month and loses 70% of them. Average order is $50.
Revenue at risk = 1,000 × 0.70 × $50 = $35,000/month
Now compare that to your product page, which gets 5,000 visitors and loses 40%. Same average order.
Revenue at risk = 5,000 × 0.40 × $50 = $100,000/month
The product page has a smaller percentage drop-off but nearly three times the dollar impact. More people pass through it.
The percentage said “fix checkout first.” The revenue said “fix the product page.” The revenue is right.
This kind of prioritization is part of a solid CRO strategy. And once you’ve identified the highest-value drop-off to fix, the next step is testing the change. A/B testing improves conversion rates only when you’re testing the right thing. Revenue prioritization helps you find the right thing.
You can set up a free split test and see whether your fix actually moves the needle before committing to a full redesign.
Segment everything (aggregate funnels lie)
This one’s important. An aggregate funnel (all your traffic, all devices, all sources, averaged together) is like averaging a sprinter’s speed with a walker’s. The average tells you nothing useful about either one.
Here’s the proof. Contentsquare’s 2026 benchmarks (99 billion sessions) found:
- Mobile drives 69.9% of traffic
- But desktop converts 74% higher (3.4% vs 2.0%)
So if your blended conversion rate is 2.5%, you’re probably looking at a desktop funnel that works okay and a mobile funnel that’s broken. Averaging them together hides both insights.
Segmentation that actually matters
Start with device type. Always. Mobile and desktop are basically two different websites for your visitors.
Then split by traffic source. People from Google search have intent. People from Instagram ads have curiosity. Those are different funnels.
Returning visitors are worth a separate look too. They already know you, so their funnel is shorter and converts higher.
A great example: Data36 covered a jewelry retailer case study where segmentation revealed that men were the actual buyers (purchasing gifts) while women were the browsers. The business had been marketing to women because they drove more traffic. The funnel analysis, segmented by gender, showed who actually completed purchases.
Mixpanel shared a similar insight from a media app. 29% of people watching short-form content immediately disliked it. That was invisible in the aggregate funnel. Only segmented analysis revealed it.
Our take: If you only run one funnel analysis this month, segment it by device. You will almost certainly discover that your mobile funnel needs work. Most companies know this intellectually. Seeing the actual numbers makes it real.
Funnel analysis vs. other analytics methods
Funnel analysis isn’t the only way to understand your customers. Here’s when to use each approach.
| Method | Best question it answers | Use when… |
|---|---|---|
| Funnel analysis | Where do people leave? | You have a defined flow (checkout, signup) and want drop-off rates per step |
| Cohort analysis | Does behavior change over time? | You want to know if last month’s signups stick around better than the batch before |
| Path analysis | What do people actually do? | You’re in discovery mode and want to see unexpected routes people take |
Funnel analysis follows a path you define. Path analysis discovers the path people actually take. If your checkout has five steps but people keep jumping from step 2 to step 4, path analysis shows you that. Funnel analysis wouldn’t.
For most small businesses, funnel analysis comes first. You need to know where the leaks are before you design a marketing experiment to fix them.
Tools for funnel analysis
You don’t need expensive software. Here’s what actually works at each budget level.
Free tools:
- GA4 Funnel Exploration covers the basics. Define steps, see drop-offs, segment by device or source. Good enough for most small businesses.
- Microsoft Clarity gives you session recordings and heatmaps for free. Pair it with GA4 and you get the “where” (GA4) plus the “why” (watching real people struggle).
Mid-range tools:
- Hotjar combines heatmaps, session recordings, and surveys. The free tier works for low-traffic sites. Paid plans start around $40/month.
- Mixpanel is strong for product funnels (SaaS especially). Good segmentation. Free for up to 20 million events.
- Amplitude is the most powerful for behavioral analysis. Free tier is generous. Better for product teams than marketing teams.
What you actually need: For most small businesses, GA4 plus a free session recording tool (Clarity or Hotjar’s free plan) covers 90% of funnel analysis needs. You don’t need Amplitude unless you’re running a product with millions of monthly active people.
Once you’ve found the drop-off and diagnosed why it’s happening, the next step is testing a fix. Kirro lets you A/B test changes at any funnel stage. Change a headline, simplify a form, add social proof, and see whether it moves conversions. You can test your first change in about three minutes.
FAQ
How do you do funnel analysis?
Define your funnel stages (4 to 8 steps from first visit to conversion). Set up tracking in GA4 or a product analytics tool. Measure the conversion rate between each step. Segment by device and traffic source. Then diagnose WHY each drop-off happens using the four categories: awareness gaps, motivation gaps, friction problems, and technical issues. Prioritize fixes by revenue impact, not just by the size of the drop-off.
What tools are used for funnel analysis?
GA4 (free, with a built-in funnel exploration report), Amplitude, Mixpanel, Hotjar, and Contentsquare. Most small businesses can start with GA4’s free funnel reports paired with a session recording tool like Microsoft Clarity.
What is the difference between funnel analysis and cohort analysis?
Funnel analysis tracks how people move through a sequence of steps and where they leave. Cohort analysis groups people by when they started (signup date, first purchase date) and tracks how their behavior changes over time. Use funnel analysis to find WHERE people leave. Use cohort analysis to find WHEN engagement changes.
What are the 4 steps of the funnel?
The classic marketing funnel has four stages: Awareness (they know you exist), Interest (they’re exploring), Desire (they want what you sell), Action (they convert). But for funnel analysis, your actual stages should match your real customer journey. An ecommerce site might use: product page → add to cart → checkout → purchase. Don’t force the textbook framework onto your data. See conversion funnel for a deeper look at funnel stages.
What is a good funnel conversion rate?
It depends on your industry, device mix, and traffic sources. Ecommerce purchase funnels typically convert at 1 to 4% overall. SaaS free-trial-to-paid funnels average about 17%. But the more useful question is: which stage of YOUR funnel has the biggest revenue leak? Fix that, and your overall rate improves. For detailed benchmarks by funnel type, compare against your industry averages.

Randy Wattilete
CRO expert and founder with nearly a decade running conversion experiments for companies from early-stage startups to global brands. Built programs for Nestlé, felyx, and Storytel. Founder of Kirro (A/B testing).
View all author posts