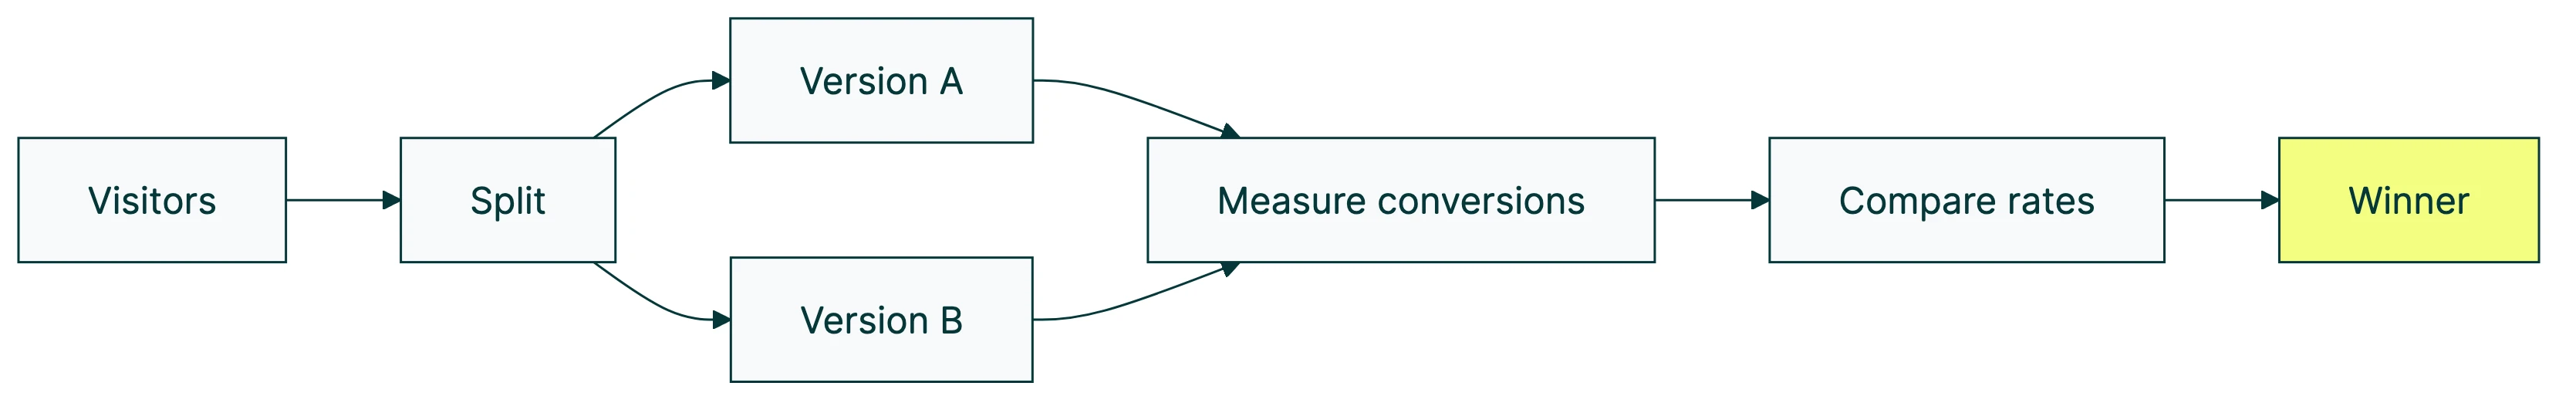
Your A/B testing conversion rate is the percentage of visitors who do what you want (buy, sign up, click) in each version of your test. Compare the rates between Version A and Version B. The bigger one wins.
That’s the simple part. The hard part? Knowing whether that difference is real. Whether your conversion rate is actually “good.” And why most tests you’ll ever run won’t produce a winner. (That last one surprises people.) For real examples, see these case studies showing A/B test results with trust ratings.
Real benchmarks from four independent datasets, honest failure rates, and three things about testing methodology that nearly every other guide pretends don’t exist. No PhD required. (Need to check if your test results are real? The significance calculator gives you a clear answer. And the A/B testing ideas list helps you pick what to test next.) (If you’re still getting started, our complete A/B testing guide walks through the basics.)
What A/B testing conversion rate actually means
The formula takes about five seconds. Conversions divided by visitors, times 100. Do it for each version. If you need a refresher on how to calculate your baseline conversion rate, we cover the full formula and its variations separately.
Version A: 100 visitors, 3 buy = 3% conversion rate. Version B: 100 visitors, 4 buy = 4% conversion rate.
Version B gets one more purchase per 100 visitors. Some teams would call that a “33% improvement” because the relative lift sounds impressive. But the absolute difference? One extra sale. On 100 visitors, that could easily be random chance.
This is where teams get tripped up. They report relative lift (“33% better!”) when the real-world difference is tiny. If your boss asks “how much better?” and you say 33%, that’s technically correct. It’s also misleading. Always report both the relative lift and the absolute difference so people can actually judge what happened.
If you’re coming from the broader world of conversion rate optimization, A/B testing is where you stop guessing and start measuring. And if you’re wondering about your click conversion rate in Google Ads specifically, that uses clicks as the denominator rather than sessions. Your CRO guide tells you what to improve. The test tells you if you actually did.
What counts as a “good” conversion rate (honest benchmarks by industry)
Ask ten people what a “good” conversion rate is and you’ll get ten different numbers. That’s because benchmarks vary wildly depending on where you look.
Four independent sources, millions of visitors, wildly different answers:
| Source | Dataset size | Average conversion rate | Top performers |
|---|---|---|---|
| Statista/Salesforce Q3 2025 | 1.5B shoppers, 67 countries | 1.6% global average | Skincare 2.7%, food & beverage 2.2% |
| Dynamic Yield (ecommerce) | Platform-wide data | 2.79% ecommerce average | Food & bev 6%, beauty 4.21%, pet care 3.73% |
| Unbounce 2024 | 464M visitors, 41K landing pages | 6.6% median landing page | Events 12.3%, SaaS 3.8% |
| First Page Sage 2025 | B2B focused | SEO ~2.6%, PPC ~1.5% | Legal services 7.4%, email ~2.4% |
See the problem? “Global average” is 1.6% if you look at Statista. It’s 2.79% if you look at Dynamic Yield. And it’s 6.6% if you only count landing pages. The same metric, three wildly different numbers.
A 2.5% conversion rate is excellent for luxury fashion (where 0.4% is normal). It’s below average for a landing page. And it tells you almost nothing about a B2B company with a six-month sales cycle.
Our take: Stop comparing yourself to industry averages. Compare against your own performance last month. Your only real competitor is your past self. If your rate is climbing, you’re winning. If it’s flat, test something bolder. For a full breakdown of industry conversion rate benchmarks by business model and channel, see our dedicated guide.
How to measure conversion rate in an A/B test (the right way)
Most guides give you a five-step checklist and call it a day. They leave out the most important part.
Step 1: Define “conversion” before you launch. Sounds obvious. But teams skip this constantly. Is it a purchase? A signup? A click? A form submission? Decide before the test starts. Not after you’re staring at the data trying to figure out which metric makes Version B look best. You also need to know what a control group is — that’s the unchanged version you’re measuring against. Before you run the test, calculate your conversion rate so you have a clear baseline to measure against. If you’re using GA4, make sure you know how to track conversion rate in Google Analytics so you’re reading the right numbers. If you haven’t locked down your test setup yet, our guide on how to design a marketing experiment walks through this step by step.
Step 2: Pick ONE primary metric. If you track five things, Version B will win on some and lose on others. You’ll be right back where you started, arguing about which number matters more. Pick the one that moves the business forward.
Step 3: Set a money metric as your safety net.
Conversion rate going up can actually mean revenue going down. Intelligems found that some tests increased conversions while decreasing revenue because visitors switched to cheaper products. You’d celebrate the win. Your bank account wouldn’t.
Revenue per visitor (RPV) catches this. It’s simple: RPV = conversion rate times average order value. If conversions go up but people buy cheaper stuff, RPV drops. That’s a signal your “winning” version is actually costing you money.
Think of it like a restaurant. You could boost the number of people who order (conversion rate up) by putting the cheapest item on the menu in giant letters. More orders. Less revenue per customer. Your accountant would not be thrilled.
Our take: Conversion rate alone is a vanity metric. It makes you feel good without telling the whole story. Always pair it with revenue per visitor. That’s the number your business actually runs on.
Step 4: Calculate how many visitors you need before launching. Set your minimum detectable effect, then run a power analysis to plan your test to get the exact number. Ron Kohavi ran testing at Microsoft, Amazon, and Airbnb. His data shows that detecting a 5% improvement at a 5% baseline needs 240,000+ visitors per version. For a 1% improvement? Over 6 million.
That’s not a typo. We’ll dig into what this means for your business in the traffic section below.
Step 5: Let it run. Don’t peek. Set your test duration upfront. Check results only at the end. We’ll explain why peeking is so destructive in the mistakes section. If you’re testing different page URLs rather than on-page changes, you’ll want split testing software instead of a visual editor tool.
Why most A/B tests don’t improve conversion rates (and why that’s normal)
Every other guide frames A/B testing as “do this, get more conversions.” It’s more interesting than that.
Ron Kohavi’s research at Microsoft found that only one-third of tests improved the target metric. One-third were flat. One-third actually made things worse. That’s Microsoft, with some of the best data scientists on the planet.
Google and Bing? Only 10-20% of tests show a positive result.
Booking.com runs 25,000 tests per year and assumes a 10% success rate. They run over 1,000 tests at the same time. Nine out of ten don’t produce a winner. And Booking.com is arguably the best in the industry at this.
Convert’s platform data tells the same story from a different angle: 60% of completed tests deliver under 20% lift. 84% deliver under 50% lift. The “double your conversion rate overnight” stories exist, but they’re rare.
So why bother?
Because every test teaches you something. Even the ones that “fail.” Especially the ones that fail. Booking.com doesn’t have great conversion rates because they win a lot of tests. They have great rates because they’ve run 25,000 of them and learned from every single one.
Think of testing like fishing. Most casts don’t catch a fish. But each one tells you where the fish aren’t. The ones that work pay for all the empty casts. And at Booking.com’s 10% success rate, running 25,000 tests a year still means 2,500 wins.
Our take: If every test you run “wins,” you’re probably making a common A/B testing mistake. A healthy testing program has a 10-30% win rate. The rest aren’t failures. They’re information. Shiva Manjunath from Speero puts it well: “If you run a program to ‘win,’ you’ll lose far more.”
5 mistakes that silently kill your A/B test results
These aren’t beginner errors. Experienced testers make them too. The tricky part is that your dashboard will still show a “winner.” You’ll implement it. Conversions drop. And you won’t know why.
1. Peeking at results before the test is done.
Checking your test daily feels responsible. It’s destructive. Evan Miller’s research showed that peeking makes you declare fake winners way more often. Without peeking, about 5% of your “wins” are random noise. With peeking? Over 26%. One in four “winners” is just luck.
Georgiev’s 2023 analysis confirmed the same thing at major companies. And Stanford researchers (Johari et al., KDD 2017) proved that repeated checking flat-out breaks the math behind traditional testing. The root cause comes down to understanding Type 1 and Type 2 errors and the null hypothesis in A/B testing . Peeking inflates both error types. Set it. Forget it. Check at the end.
2. Stopping when it “looks” significant.
Your test has been running four days. Version B is up 40%. You call it. Problem: you haven’t captured a full week. Weekday visitors and weekend visitors act differently. Run every test for at least 14 days, on 7-day boundaries. Tuesday to Tuesday. Not Tuesday to Friday-because-it-looks-good.
There’s a sneaky trap here too. When a test barely crosses the confidence line, the number it shows is probably inflated. Like a fishing story where the fish gets bigger with every retelling. (Researchers call this the “winner’s curse.” You just need to know: early results exaggerate.)
3. Not running long enough for the “new” to wear off.
New things get clicks because they’re new. Not because they’re better. A fresh button design might win for two weeks, then performance drops back to normal. Run for minimum two full business cycles (2-4 weeks) and watch if the effect holds or fades.
4. Ignoring broken traffic splits.
Your test should split traffic roughly 50/50. Microsoft and Booking.com found that 6% of tests have broken randomization. Think of it as a rigged coin. If traffic isn’t splitting evenly, nothing your test tells you is reliable. Always check the split before trusting results.
5. Using conversion rate as your only metric.
We covered this above. Repeating it because it’s that common. Conversion rate up, revenue down. It happens when your “winning” version pushes people toward cheaper products. Always pair conversion rate with revenue per visitor. If you’re using CRO tools or A/B testing tools that only show conversion rate, add a revenue check manually. For the full picture, see our guide to CRO metrics . It covers which KPIs matter beyond conversion rate. And our A/B testing metrics framework shows how to organize primary, guardrail, and secondary metrics so you know which numbers actually decide the winner.
How much traffic you actually need (the math competitors won’t tell you)
Every competitor guide says “calculate your sample size.” None of them show you the actual numbers.
- 5% baseline, detecting 5% improvement: 240,000+ visitors per version
- 5% baseline, detecting 1% improvement: 6,000,000+ visitors per version
Peep Laja (founder of CXL) gives a practical rule: minimum 350 conversions per version before you trust anything. Joris Bryon says don’t bother testing with less than 1,000 transactions per month. Analytics Toolkit puts it bluntly: most small and medium businesses “may not see enough visitors in a whole year” for a traditional test.
A simple way to think about it:
| Your monthly conversions | What you can realistically test |
|---|---|
| Under 1,000 | Big swings only: completely different headlines, new page layouts, different offers |
| 1,000 to 5,000 | Meaningful changes: layout shifts, button copy, form length (see form conversion rate benchmarks for what to aim for) |
| 5,000+ | Subtle tweaks: button colors, microcopy, image swaps |
If you get 500 conversions a month, don’t test button colors. Test a completely different headline. Or a different pricing structure. You need big, obvious changes because your “magnifying glass” (the number of visitors you have) can only spot big differences.
What if your traffic is too low for traditional testing?
Four options:
-
Use math that works with less traffic. Bayesian statistics can reduce required sample sizes by up to 75% compared to traditional testing. Instead of waiting for a hard yes/no, you get a probability: “There’s an 89% chance Version B is better.” It updates as data comes in, like a weather forecast that gets more accurate each hour. Kirro uses this approach, so you get useful answers faster, even on sites with modest traffic. You can try it free for 30 days and see the difference firsthand.
-
Test your highest-traffic page first. Your homepage probably gets more visitors than your pricing page. Start there.
-
Make bolder changes. A 50% improvement is detectable with far less traffic than a 5% improvement. Test a completely new headline, not a slightly different shade of blue. You can also apply variance reduction with CUPED to squeeze more signal out of the traffic you already have.
-
Consider research instead. Under 1,000 monthly conversions, qualitative research (customer interviews, session recordings, heatmaps) might tell you more than a test could. Use the research to figure out what to test, then test it when you have enough traffic.
And there’s a fifth factor many teams overlook: cookie consent banners are shrinking testable audiences even further, making accurate measurement harder. Our guide on cookieless measurement challenges covers how to handle this.
Our take: Low traffic isn’t a reason to skip testing. It’s a reason to test bolder ideas. And to use math designed for smaller samples. The worst thing you can do is run a test with too little traffic and make decisions based on the results.
How to actually improve conversion rates with A/B testing
Most teams jump straight to testing random ideas. “Let’s try a green button.” “What about a different hero image?” That’s like picking lottery numbers. You might win, but the odds aren’t great.
Peep Laja says it best: “CRO is 80% research, 20% testing.” The research tells you where the problems are. The tests confirm whether your fix actually works. Start by running a CRO audit to find where your biggest conversion leaks are. Then use a CRO testing plan to decide which test type actually fits your traffic and timeline.
Test the highest-impact stuff first. Follow the A/B testing best practices guide for a data-backed prioritization framework. Headlines, calls to action, value propositions above the fold, and A/B testing for pricing if revenue per visitor is your goal. These are the high-converting landing page elements that affect the most visitors, especially on landing pages where landing page optimization has the most direct impact on conversion rates. Identifying conversion funnel drop-off points helps you focus tests on the stages where visitors actually leave. Testing footer links when your headline is confusing is like rearranging deck chairs on a ship with a hole in it. If you’re running paid campaigns, testing Facebook and Instagram ads and Google Ads conversion testing can improve conversion rates before visitors even reach your site. If your pages also drive organic traffic, learn about optimizing conversions without hurting rankings before making structural changes.
Ben Labay from Speero recommends a portfolio approach. Split your tests: 20% small iterations (button copy, colors), 20% substantial changes (layout, messaging), and 20-40% big bets. Big bets fail more often. But when they win, they win big.
And watch out for what’s called the “local maximum” trap. If you only ever test small tweaks, you might find the best shade of blue for a button on a page that shouldn’t exist. Sometimes you need to throw out the whole approach. Small tweaks find local peaks. Bold changes find mountains. (Ready to test multiple elements at once? Multivariate testing is the next step up, though our multivariate testing vs A/B testing comparison shows why most teams should stick with sequential A/B tests. Or if you want to optimize conversions while the test is still running, bandit testing automatically shifts traffic toward the winning version.)
Run full business cycles. Minimum 1-2 weeks, always spanning weekdays and weekends. Visitor behavior shifts between Tuesday afternoon and Saturday morning.
And document everything. Winners, losers, inconclusive tests. The losers are actually more valuable because they narrow your focus. If a headline test doesn’t move the needle, the problem isn’t the headline. Move deeper.
The real game isn’t one big win. It’s compounding. Even modest 5% improvements stack up fast. Five winning tests at 5% each means your conversion rate grows 27% over the year. That’s the kind of steady growth that actually builds a business.
If you want to start testing today, Kirro lets you set up your first test in about three minutes. Pick a page, change a headline, and let the numbers decide. No statistics degree needed.
For the full stack of tools that support testing and conversion rate optimization, check our CRO software guide. Specifically comparing testing platforms? Our A/B testing software breakdown covers pricing, features, and what each tool is good at.
FAQ
What is A/B testing conversion rate?
The percentage of visitors who take a specific action (purchase, signup, click) in each version of an A/B test. You compare conversion rates between Version A and Version B to see which performs better. Formula: conversions divided by visitors, times 100. If 100 people visit Version B and 4 buy, that’s a 4% conversion rate.
Is a 2.5% conversion rate good?
It depends on your industry and page type. For luxury ecommerce (where 0.4-0.9% is average), 2.5% is excellent. For a landing page (where 6.6% is the median according to Unbounce), it’s below average. For B2B legal services (where 7.4% is typical), it’s low. Always compare against your own past performance, not arbitrary benchmarks.
How much does A/B testing cost?
Free tools exist but have limits. Open-source options like GrowthBook cost nothing but need a developer to set up. Mid-range tools like Kirro cost EUR 99/month with unlimited tests and visitors. Enterprise tools like Optimizely start around $36,000/year (and you’ll need a sales call to find out). Our A/B testing tools guide compares the full range. The bigger cost isn’t the tool. It’s the traffic and patience needed to run reliable tests.
What is a good B2B conversion rate?
According to First Page Sage: B2B SEO averages about 2.6%, PPC about 1.5%, email about 2.4%. SaaS visitor-to-lead sits around 1.4%. B2B sales cycles are longer though, so conversion rate alone doesn’t tell the whole story. Track pipeline value and revenue per visitor too. Our full B2B-specific conversion testing guide covers what to measure and how to test when traffic is low.
How long should an A/B test run?
Minimum two full weeks (captures weekday and weekend patterns). But the real answer depends on your traffic. At 1,000 daily visitors and a 3% conversion rate, expect roughly 33 days per test. Use a sample size calculator before you launch, not a calendar. If you rush it, you get bad data. For the math behind this, see our sample size formula guide.
Can you A/B test with low traffic?
Yes, but adjust your approach. Under 1,000 monthly conversions, test big changes only: new headlines, different page layouts, completely different offers. Button color tests need 100,000+ visitors to spot a difference. Use Bayesian statistics (math that works faster with smaller samples) and focus on your highest-traffic page first. If your traffic is very low, qualitative research (interviews, heatmaps) might teach you more than a test. Our Google Optimize alternatives guide compares tools that work well with smaller audiences.

Randy Wattilete
CRO expert and founder with nearly a decade running conversion experiments for companies from early-stage startups to global brands. Built programs for Nestlé, felyx, and Storytel. Founder of Kirro (A/B testing).
View all author posts