B2B conversion rate optimization is about getting more of your website visitors to do the thing you want. Request a demo. Start a free trial. Download a report. Whatever “yes” looks like for your business.
But B2B is different. Your buyer isn’t one person browsing on their couch. It’s a committee of thirteen people (Gartner), spending months researching before they’ll even talk to sales. And most B2B websites don’t get enough traffic for the kind of tests consumer sites run.
That changes everything about how you improve conversions. If you want the basics of conversion rate optimization, start there. This guide is for what makes B2B different, and what to do about it. (Calculate your B2B conversion rates with the conversion rate calculator.)
What B2B conversion rate optimization actually means
The concept is simple. You have visitors. Some percentage of them do what you want. That percentage is your conversion rate. Making it go up is conversion rate optimization.
The B2B part is where things get interesting.
In B2C, someone sees a pair of shoes and buys them. Maybe in the same session. In B2B, someone sees your product, bookmarks it, mentions it in a meeting, gets approval from three departments, and maybe fills out your demo form. Two months later.
B2B conversions look different too. You’re not counting purchases. You’re counting demo requests, free trial signups, content downloads, and pricing page visits. Each of those has wildly different conversion rates, and each one matters at a different point in the buying process. (Local and service-area businesses face a similar challenge with different conversion types, and our local business CRO guide covers that side.)
The other big difference? Volume. A B2C ecommerce site might get 500,000 visitors a month. A B2B SaaS site might get 5,000. Fewer visitors, higher stakes per conversion. Every tactic and every test has to account for that. That’s why many B2B teams work with CRO agencies who specialize in low-traffic optimization.
B2B conversion rate benchmarks (the numbers that actually matter)
Here’s where most articles get it wrong. They’ll tell you “a good B2B conversion rate is 2-5%” and move on. That’s like saying “a good salary is $50K-$200K.” Technically true. Completely unhelpful.
The number depends on what you sell and for how much. Grey Matter’s analysis of Unbounce 2024 data breaks it down by deal size (what a typical deal is worth per year):
- Enterprise ($500K+ per year): 0.5-1.5% conversion rate
- Mid-market ($50K-$500K per year): 1.5-3%
- Lower mid-market ($10K-$50K per year): 2.5-5%
See the pattern? The bigger the deal, the lower the rate. That’s not a problem. That’s expected. When a single conversion might be worth $500,000, you don’t need many of them.
By industry, the spread is just as wide. First Page Sage tracked client data across 2022-2025 and found:
| Industry | Average conversion rate |
|---|---|
| Legal services | 7.4% |
| HVAC | 3.1% |
| Staffing & recruiting | 2.9% |
| Manufacturing | 2.2% |
| Financial services | 1.9% |
| IT / managed services | 1.5% |
| SaaS | 1.1% |
HockeyStack Labs studied 80 B2B SaaS companies and 31 million visitors. SaaS average: 1.1% per unique visitor. But that hides huge differences by page type. Demo pages converted at 5.5%. Pricing pages at 3.8%.
By traffic source, the numbers shift again. Email traffic converts at 19.3%. Paid social at 12%. Paid search at 10.9%. Display ads at 4.1%.
Our take: If someone tells you your “conversion rate is low” without asking about your deal size, industry, and traffic source, they don’t know what they’re talking about. A 0.8% rate on a $500K product is wildly profitable. A 5% rate on a $500 product might not be.
How B2B CRO is different from B2C (and why it matters)
B2C optimization advice dominates the internet. “Simplify the checkout.” “Add social proof.” “Remove friction.” Those tips aren’t wrong, they’re just built for a world where someone lands on a page and buys within minutes. If you’re on the ecommerce side, our guide to Shopify store optimization shows what that looks like in practice.
B2B doesn’t work that way.
Multiple buyers, one website. An average B2B purchase involves 13 people (Gartner). Your page has to convince the researcher, the internal champion, AND the person holding the budget. One page. Three very different audiences.
The self-service paradox. 61% of B2B buyers prefer a rep-free experience. They want to research, compare, and decide alone. But those same buyers are 1.65x more likely to regret their purchase. The sweet spot is a mix of digital and human.
Longer research cycles. B2B buyers read 3-7 pieces of content before talking to a rep. Thirteen pieces before buying (Demand Gen Report 2024). Your conversion strategy can’t be one page. It’s a trail of content, each piece building trust for the next.
Post-purchase regret is the norm. 81% of B2B buyers are dissatisfied with their chosen provider. 86% of purchases stall mid-process (Forrester 2024). The funnel doesn’t end at “form submitted.” Your website has to reduce anxiety at every stage.
The 5 B2B conversion points worth testing
Not all conversions are equal. Here are the five that move the needle for B2B, in order of impact.
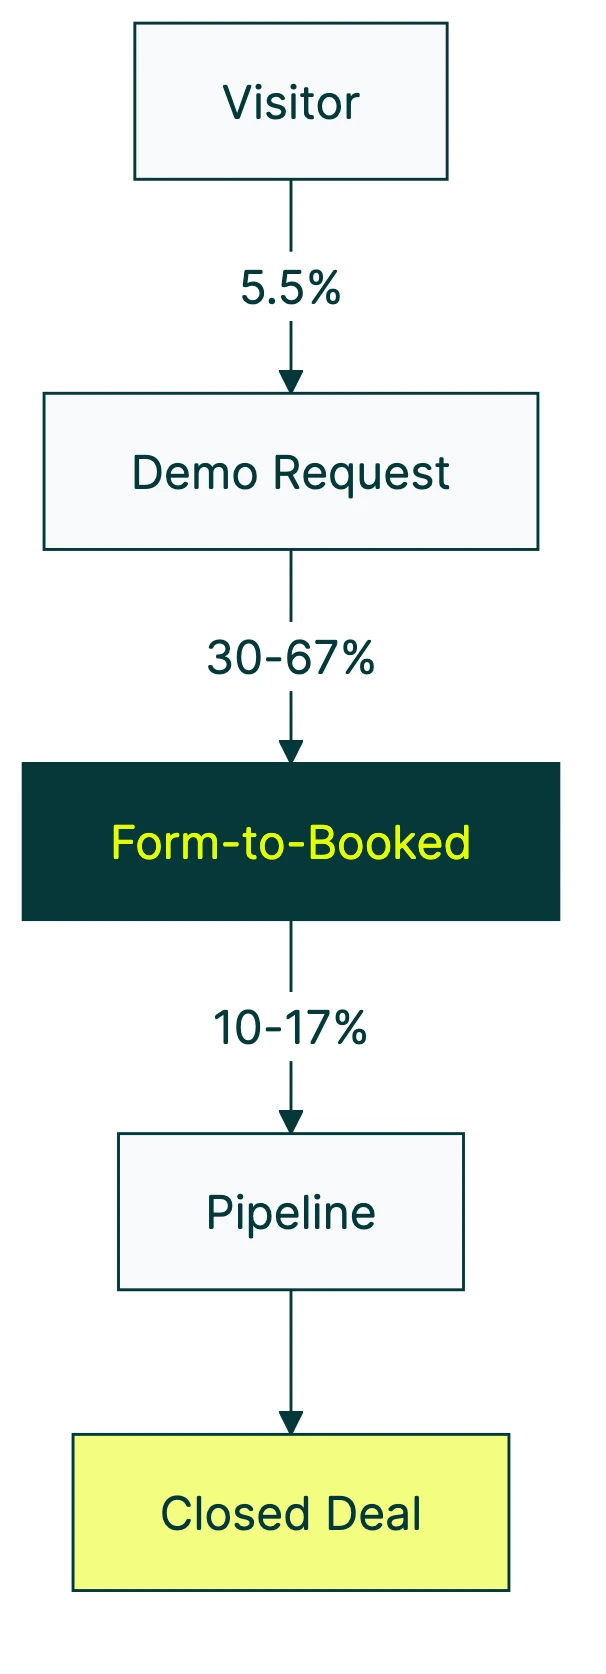
1. Demo request pages. These convert at about 5.5% on average (HockeyStack). The biggest opportunity? The gap between “form submitted” and “meeting booked.” Chili Piper analyzed 4 million demo submissions. Embedding a calendar on the form page boosted form-to-booked from 30% to 66.7%. That’s doubling your pipeline from one change.
14.1% of submissions get disqualified. Route enterprise leads to senior reps, smaller leads to self-service.
2. Pricing pages. These get 13x more traffic than demo pages (HockeyStack). Transparent pricing gets fewer form fills (2.8% vs 4.6% for hidden pricing). But the leads are 1.7x better. 17.5% become real pipeline, versus 10.31% for “contact us for pricing.” You can split test your landing pages to find which approach fits your price point.
3. Free trial signups. Opt-in trials (no credit card) average 18.2% signup rates. Opt-out trials (card required) average 48.8%, but most cancel. Higher signup numbers don’t always mean more paying customers.
4. Content downloads. Gated content (stuff behind a form) still works. Demand grew 77% since 2019 (NetLine, 6.2 million registrations). The tradeoff: gated content gets cited 64% less by AI search tools (Brixon Group). So be selective. Industry benchmarks convert at 34.8% when gated. General whitepapers? Only 11.7%. Gate the good stuff. Let the awareness content breathe.
5. Small actions that predict pipeline. The industry calls these micro-conversions (small actions that show someone is seriously interested). Pricing page visits. Case study views. Return visits within 7 days. Multiple pages per session (B2B SaaS averages 2.62). Not conversions by themselves, but the smoke that tells you there’s fire.
How to improve each conversion point
Theory is nice. Let’s get practical.
Demo request flows. The gap between “form filled” and “meeting happens” is where most leads die. Embed your calendar on the confirmation page. Or better, on the form itself. People fill out a form while they’re motivated. Make them wait 48 hours for an email, and half of them cool off.
Pricing pages. If you can show prices, show them. The 1.7x pipeline quality difference is hard to argue with. If you genuinely can’t show exact prices, use “starting at” ranges and build an ROI calculator. Anything beats “contact sales.”
Forms, and the myth that fewer fields always win. Everyone says “fewer form fields, more conversions.” B2B conversion optimization data says otherwise. CXL documented a B2B software company where adding a qualifying step (an extra question about their needs) increased conversions by 20%.
Why? Because the question showed the buyer: “This company actually cares about having a relevant conversation with me.”
MarketingExperiments found something similar: a 15-field form outperformed an 11-field form by 109%. More fields isn’t always worse.
But some fields are toxic. Phone number requests drop conversions 57%. Budget questions drop them 41% (Brixon Group). The rule isn’t “fewer fields.” It’s “add questions that help, remove questions that feel invasive.” For more on form strategy and the five elements that drive lead gen landing page best practices, see our dedicated guide.
Content gating. Gate industry benchmarks (34.8% conversion rate) and data reports (28.6%). Leave product descriptions ungated (5.2%). Forrester found that ungated awareness content gets 1,100% higher consumption. Let people discover you. Save the gate for the stuff that’s genuinely worth trading an email for.
Page speed. Portent analyzed 14 B2B lead gen sites and 100+ million page views. Sites loading in 1 second converted 3x better than 5-second sites. B2B sites tend to be slower too (heavier pages, enterprise CMS bloat). Check yours.
If you’re not sure what to improve first, start with a CRO audit. It gives you a prioritized list instead of guessing.
Testing B2B conversions when your traffic is low
This is the section nobody else writes. And it’s the one most B2B marketers actually need.
Conversion Rate Experts say you need about 5,000 visitors per week to one page for a reliable A/B test. Most B2B sites get 2,000-10,000 monthly visitors total. Across the whole site.
At a 1.5% conversion rate, that’s 30-150 conversions per month. Not enough for traditional testing to tell you anything real. It’s like flipping a coin 10 times, getting 7 heads, and concluding it’s rigged. You just don’t have enough flips yet.
So what do you do?
Use math that works with less data. Standard testing gives you a pass/fail answer. You either have enough evidence or you don’t (statisticians call this “frequentist” testing). A better approach for small samples: math that tells you the probability one version beats another (called Bayesian statistics). Kirro uses this by default.
You can set up a free test and see results like “Version B has a 92% chance of being better” instead of waiting for a yes/no that might never come.
Lower your confidence bar. The industry standard is 95% confidence (how sure you need to be before declaring a winner). For B2B, 85-90% often makes more sense. Some useful data beats no data. Just be honest about the uncertainty. More on what a good conversion rate looks like and how confidence plays in.
Focus your traffic. Don’t test 5 pages at once. Pick the page with the highest traffic and most valuable conversion. For most B2B sites, that’s demo or pricing. Concentrate visitors there. Understanding your conversion funnel helps you spot the right bottleneck.
Go qualitative. When numbers can’t tell the story, ask real people. Five user testing sessions often reveal more than a month of inconclusive data. Record session videos. Interview recent buyers. Listen to sales calls for objections that keep coming up.
Test smaller actions too. Final conversions are rare in B2B. But engagement signals (scroll depth, time on page, button clicks) happen far more often and often predict the big conversion. Our CRO testing guide covers picking the right thing to test.
These aren’t perfect substitutes for high-traffic A/B testing. They’re practical alternatives. Our guides on Bayesian testing, A/B testing and conversion rates, and the sample size formula go deeper on the math.
Our take: We see B2B teams skip testing entirely because they read that they “need 50,000 visitors” first. That’s not true. You need to pick the right method for your traffic. Something is always better than guessing.
Why adding friction can actually improve your B2B results
This sounds backwards. Every CRO article in the world says “reduce friction.” Fewer steps. Fewer clicks. Fewer fields. Make it as easy as possible.
For B2C, sure. When someone wants to buy a $30 t-shirt, don’t make them fill out 15 fields.
B2B is different.
That CXL case study is worth repeating. A B2B software company added an extra step to their form. Not a random step. A question about the prospect’s situation. Conversions went up 20%. The question signaled: “We’re going to have a real conversation, not just dump you into a sales sequence.”
Pricing transparency works the same way. HockeyStack found that showing prices means fewer form fills (2.8% vs 4.6%). But those leads convert to pipeline at 17.5%, versus 10.31% for “contact us” forms. The friction filtered out tire-kickers. The people who remained were 1.7x more likely to become real deals.
And the Gartner paradox? Buyers who go fully self-service (zero friction, zero human contact) are 1.65x more likely to regret their purchase. Lowest regret comes from digital commerce with some human touchpoints built in.
The principle: a 2% conversion rate that produces qualified demos beats a 5% rate that produces unqualified form fills. Don’t just build a CRO strategy around volume. Build it around quality.
Lincoln Murphy from Sixteen Ventures puts it well: “If 97% of visitors aren’t converting, it isn’t their fault, it’s yours.” The fix isn’t always less friction. Sometimes it’s better visitors and better qualifying. Peep Laja’s Wynter message testing data backs this up: clarity beats persuasion. One company saw 73% better conversions from messaging changes alone.
If you want to test whether a higher-friction version of your page actually wins, run the test. The data will settle the debate.
B2B CRO metrics that matter (beyond conversion rate)
Conversion rate is table stakes. It tells you what percentage of visitors filled out a form. Not whether those people were worth talking to.
Track these alongside (or instead of) raw conversion rate:
Submit-to-pipeline rate. What percentage of form fills become real sales opportunities? If 100 people request a demo and only 5 become real deals, your conversion rate looks great but your pipeline is thin. Our guide on lead to sale conversion benchmarks breaks down what to expect at each stage, and our average lead conversion rate by industry data shows where you stand relative to your peers. For outbound specifically, see our cold calling conversion rates by funnel stage and industry.
How fast you respond matters too. Default analyzed 88,000 leads. Cutting response time from 48 minutes to 2 minutes dramatically improved conversion. When someone fills out a form, they’re interested right now.
Lead qualification rate tells you what percentage of leads are ready for a real sales conversation. RevenueHero’s 2025 data: healthy is 60-70%. Strong programs hit 70-80%. Teams doing 90%+ are rare, but they exist.
Then there’s revenue per visitor. This one metric captures traffic quality and conversion together. It’s a better north star than conversion rate because it doesn’t reward gaming the system with junk leads.
Finally, watch pages per session and return visitor rate. B2B SaaS averages 2.62 pages per session (HockeyStack). Gartner says buyers do 80% of their research through self-directed browsing. If visitors bounce after one page, your content isn’t pulling its weight. If they keep coming back, you’re building trust. That’s what eventually converts.
Our CRO metrics guide covers setting this up without drowning in dashboards. If you’re building a CRO program, these metrics are the foundation. And Kirro tracks the engagement signals that matter for B2B, so you’re measuring the right things from the start.
When you hear CRO recommendations from consultants, ask which of these metrics they plan to move. If they only talk about form fills, they’re not thinking about B2B correctly.
FAQ
What is a good B2B conversion rate?
It depends on deal size and industry. Enterprise ($500K+ deals): 0.5-1.5%. Mid-market ($50K-$500K): 1.5-3%. Lower mid-market ($10K-$50K): 2.5-5%. Overall B2B average is about 2.9% (First Page Sage). SaaS specifically: 1.1% per unique visitor (HockeyStack Labs). Compare against your deal-size tier, not a generic number. More context in our guide on what is a good conversion rate, or see SaaS-specific benchmarks.
How is B2B CRO different from B2C?
Three things. You’re selling to a committee (average 13 people), not one person. The buying cycle takes months, not minutes. And each conversion is worth far more, but you get far fewer. This changes what you test, how you test, and how long you wait for results. Also see common A/B testing mistakes B2B teams make when applying B2C tactics.
Can I A/B test with low B2B traffic?
Standard A/B testing needs about 5,000 visitors per week to one page. Most B2B sites don’t have that. Alternatives: Bayesian statistics (math that works with smaller groups), 85-90% confidence instead of 95%, focus on your highest-traffic page, and supplement with qualitative research (customer interviews, session recordings).
Should I gate B2B content behind forms?
It depends on the content type. Industry benchmarks convert at 34.8% when gated. General whitepapers only 11.7%. Gate high-value research and data. Leave awareness content open. One thing to know: gated content is cited 64% less in AI search results (Brixon Group), so there’s a discovery tradeoff.
How many form fields should a B2B lead form have?
The “fewer fields = more conversions” rule is a myth in B2B. Adding relevant qualifying questions can increase conversions (CXL documented a 20% lift). But invasive fields kill forms. Phone number requests drop conversions 57%. Budget questions drop them 41%. Add questions that help you have a better conversation. Remove ones that feel like surveillance.
When should I hire a CRO agency for B2B instead of doing it myself?
When the math works. If a 10-20% conversion improvement would cover the agency cost many times over, go for it. If you’re earlier stage, start with DIY testing to build a baseline. Our guide on CRO services covers pricing. For solo experts, see hiring a CRO consultant. CRO agencies covers how to vet firms.

Randy Wattilete
CRO expert and founder with nearly a decade running conversion experiments for companies from early-stage startups to global brands. Built programs for Nestlé, felyx, and Storytel. Founder of Kirro (A/B testing).
View all author posts