SaaS conversion rate benchmarks at a glance
What is a good SaaS conversion rate? Short answer: it depends on your model type, your price point, and whether you ask for a credit card upfront.
That 8% median comes from ChartMogul’s January 2026 report, covering 200 SaaS products. Co-authored by Kyle Poyar (the pricing guy everyone reads). It’s the freshest number available.
But “8%” by itself is almost useless. A product with a free plan converting 3% of signups might be doing great. A free trial with credit card required converting at 25% might be underperforming.
The model changes everything.
Quick view below. For the broader picture, see our conversion rate benchmarks across all industries. We also cover how to calculate conversion rate and what CVR means if you need the basics.
| Model type | Good | Great | Source |
|---|---|---|---|
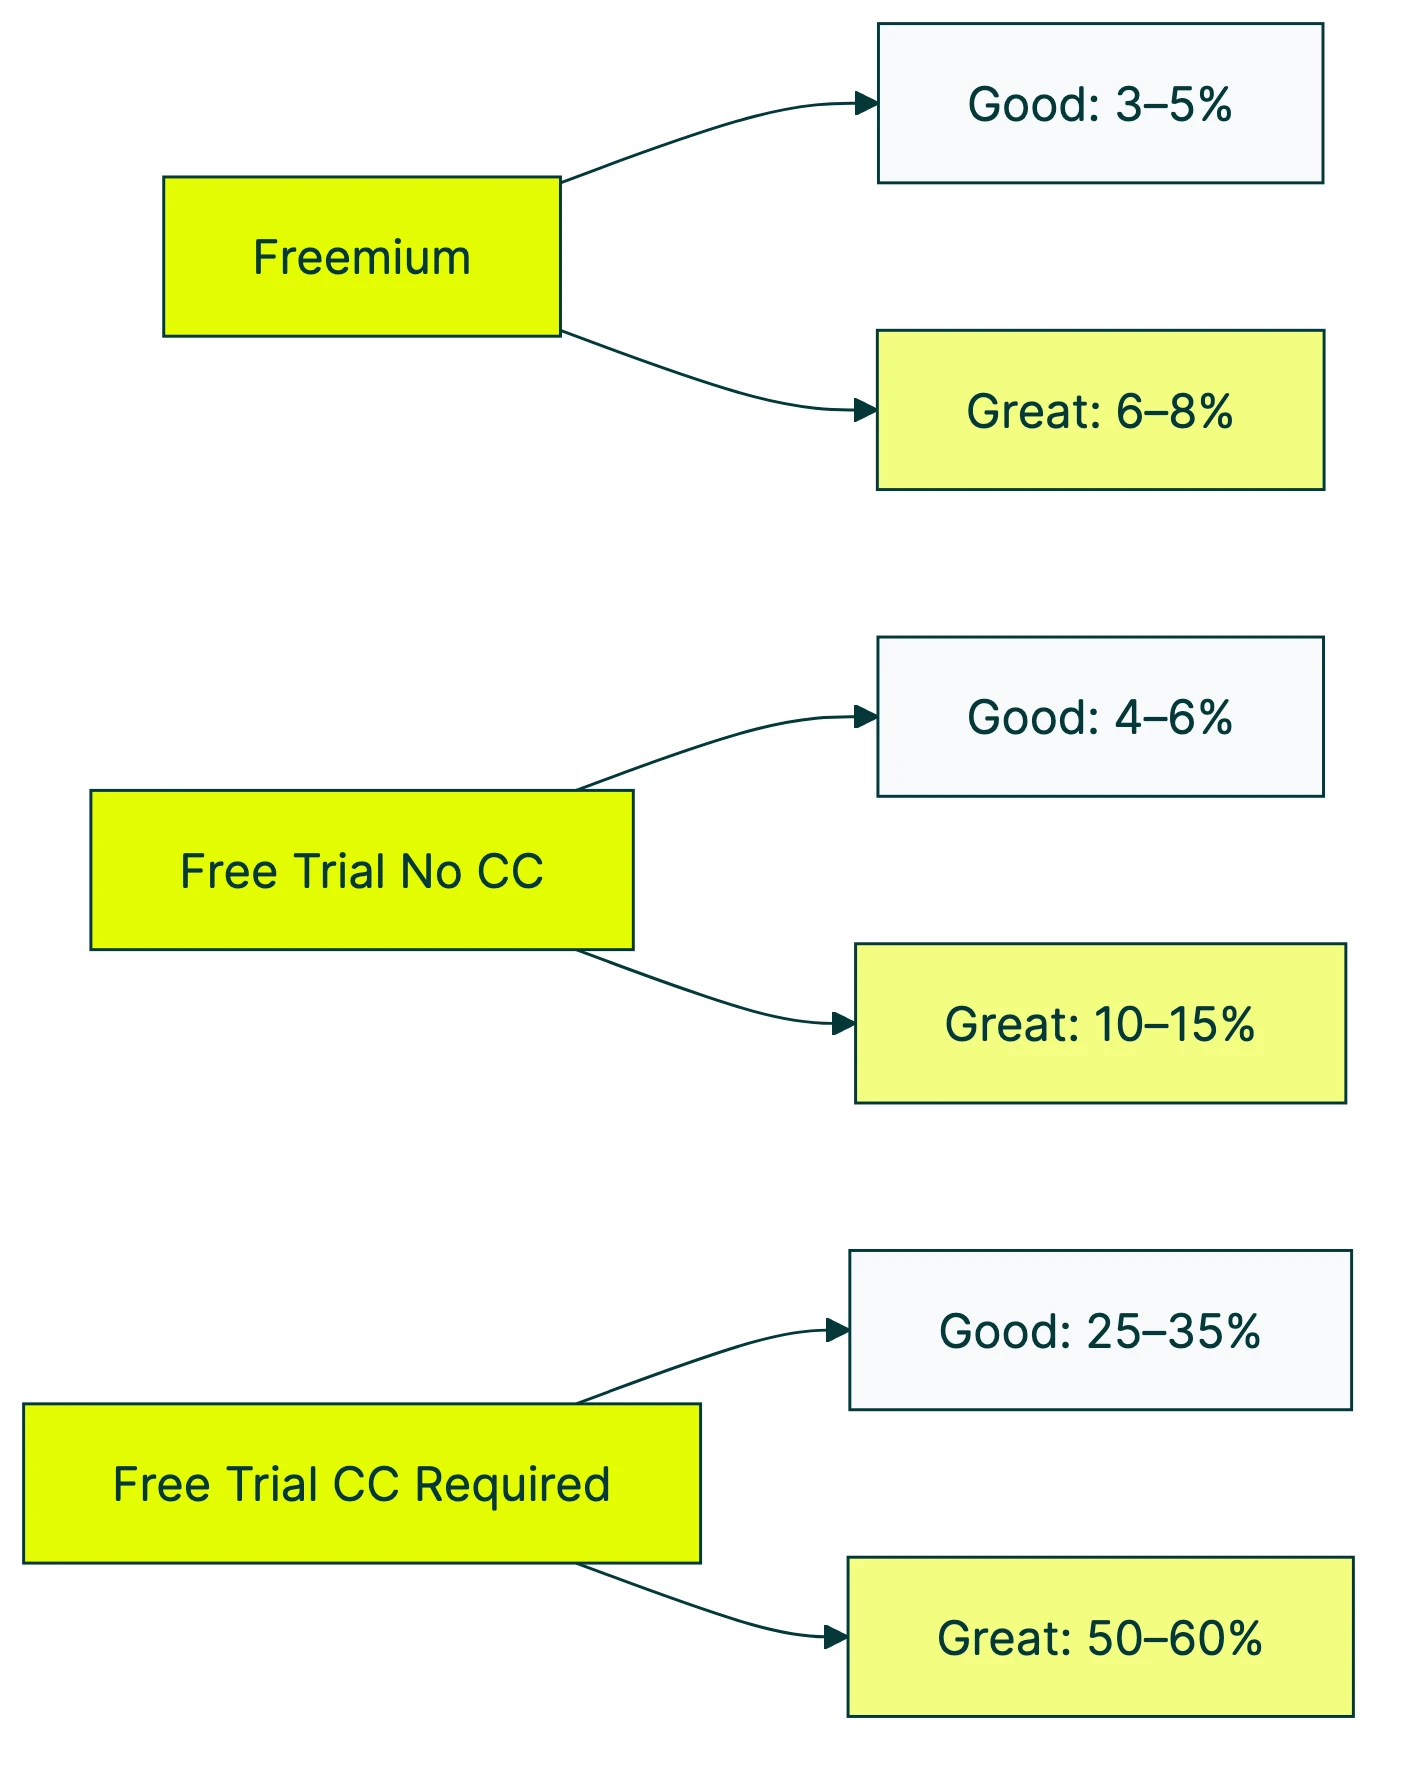
| Freemium (self-serve) | 3–5% | 6–8% | Lenny/OpenView/Pendo, 1,000+ products |
| Free trial (no credit card) | 4–6% | 10–15% | ChartMogul 2026, 200 products |
| Free trial (credit card required) | 25–35% | 50–60% | ChartMogul 2026 |
| Sales-led (demo request) | ~67% form-to-meeting | — | Chili Piper 2024, 4M submissions |
Benchmarks tell you where you stand. Conversion rate optimization tells you how to move. And if you’re running paid campaigns, SaaS CTR benchmarks help you understand what’s happening before the click.
Kirro lets you test changes on your signup pages in minutes. Already know your number? Set up a quick test and see what happens.
B2B SaaS conversion rate benchmarks by model type
Most B2B SaaS conversion rate benchmarks floating around the internet mix all models together. That’s like averaging a marathon runner’s time with a sprinter’s and calling it “the speed of running.” Useless.
Here’s how the numbers break down when you separate them properly.
Freemium self-serve
Freemium means people can use your product for free, forever, with limitations. Think Slack, Notion, or Canva. You’re betting that enough free accounts will eventually want the paid features.
The Lenny Rachitsky/OpenView/Pendo survey (2023, 1,000+ products) found:
- 3–5% free-to-paid is good
- 6–8% is great
- Visitor-to-signup rate: 9–13%
That last number matters. Freemium pulls in a lot of signups because there’s no risk. Nine out of 100 website visitors sign up. But most never pay.
Free trial (no credit card)
You let people try the full product for a set period, no payment info needed. Most SaaS does this. ChartMogul’s data shows 57% of SaaS products use free trials.
- 4–6% trial-to-paid is good
- 10–15% is great
- Visitor-to-signup: 2.5–5%
Fewer people sign up compared to freemium (because there’s a time limit creating pressure), but those who do are more serious.
Free trial (credit card required)
Same as above, but you ask for payment info upfront. Only about 20% of SaaS products do this.
- 25–35% trial-to-paid is good
- 50–60% is great
The numbers look amazing because you’ve already filtered out the tire-kickers. But your top-of-funnel shrinks dramatically. Fewer people sign up when they have to enter a credit card.
Sales-led (demo request)
For higher-priced products where people fill out a form to book a demo. Chili Piper’s 2025 report analyzed 4 million form submissions:
- 66.7% of qualified forms become booked meetings
- 14.1% disqualification rate
This is a completely different funnel. If you’re selling $50K contracts, comparing your numbers to a self-serve freemium product is like comparing apples to office furniture. For more on the sales-led side, see our conversion rate for lead generation benchmarks.
Our take: Most SaaS founders obsess over the trial-to-paid number. But the visitor-to-signup rate often matters more. A 15% trial conversion with only 1% of visitors signing up? That’s 0.15% of your traffic converting. Fix the leaky bucket at the top first.
SaaS free trial conversion rate benchmarks
By trial length
From ChartMogul’s 2026 data:
| Trial length | % of SaaS using it |
|---|---|
| 14 days | 62% |
| 7 days | 14% |
| 30 days | 14% |
Fourteen days is the default for a reason. It’s long enough for someone to see the value, short enough to create urgency. Tomasz Tunguz (Redpoint Ventures) found that time-based and usage-based trials convert about 2x better than feature-limited or seat-limited ones.
Opt-in vs. opt-out trials
“Opt-in” means the person has to actively choose to pay after the trial. “Opt-out” means they entered a credit card and get charged automatically unless they cancel. Big difference.
First Page Sage’s data across 86 companies:
- Opt-in trials: 18.2% trial-to-paid
- Opt-out trials: 48.8% trial-to-paid
That 2.7x gap is partly real and partly math. Opt-out trials include people who forgot to cancel. Whether that’s “conversion” or “inertia” depends on your philosophy (and your churn rate three months later).
The decline nobody’s talking about
None of the top-ranking articles mention this. Trial conversion rates are dropping.
Recurly’s subscription data across 2,200+ brands tells the story:
- 2023: 50% median trial-to-paid
- 2025: 34% median trial-to-paid
That’s a 32% decline in two years. Recurly attributes it to buyers being “more intentional” and the rise of micro-subscriptions (where only 13% convert to recurring). Mixpanel’s 2024 report backs this up: Week 1 retention across all industries dropped from 50% to 28%.
People are signing up for more things and committing to fewer. If your trial conversion rate dropped recently, you might not have a product problem. You might have a timing problem. The whole market shifted.
For the full cross-industry picture on free trial conversion rate benchmarks (not just SaaS), we cover that separately.
Our take: The declining trend means any benchmark from 2021 or earlier is outdated. If you’re comparing yourself to a “25% average” from a pre-pandemic study, you’re aiming at a target that moved. Use 2024+ data or don’t bother benchmarking.
SaaS conversion rates by company stage and price point
ProductLed’s February 2025 report surveyed 600+ companies and segmented by ACV (annual contract value, meaning how much a customer pays per year).
| ACV tier | Top quartile free-to-paid | Median |
|---|---|---|
| Under $1,000/year | 24% | — |
| $1,000–$5,000/year | — | 10% |
| $5,000–$10,000/year | Strong with PQLs | — |
The sweet spot is the $1K–$5K range. It’s expensive enough that people take it seriously, cheap enough that they can buy without a procurement process.
The PQL effect
A PQL (product-qualified lead) is someone who actually used your product and showed buying signals. Think: they created a project, invited a teammate, or hit a usage limit. It’s the opposite of an MQL (marketing-qualified lead), which just means they downloaded a whitepaper.
Only 24–25% of SaaS companies track PQLs. But the ones that do see roughly 3x higher conversion:
- $1K–$5K ACV with PQLs: 30% free-to-paid
- $5K–$10K ACV with PQLs: 39% free-to-paid
That’s a massive gap. It suggests the bottleneck for most SaaS isn’t the product. It’s knowing which signups are actually engaged.
If you’re not tracking what people do inside your product during a trial, you’re guessing who to follow up with.
Developer products convert lower
The Lenny/OpenView/Pendo survey found one more thing worth knowing: products built for developers have a 50% lower median conversion (around 5%) compared to non-developer products.
Why? Developers are notorious for building workarounds, using open-source alternatives, and resisting anything with a “contact sales” button. This isn’t a bug in your funnel. It’s the audience.
ProductLed found no significant differences by company revenue, growth rate, or horizontal vs. vertical positioning. Model type and price point are what matter. Everything else is noise.
The benchmarks paradox: why “average” can mislead you
We just threw a lot of numbers at you. Now let’s talk about why you should be careful with all of them.
The 10x gap
ChartMogul’s distribution data shows how wide the spread really is:
- 20% of SaaS products convert below 2.5%
- 23% of products convert above 25%
That’s a 10x gap between the bottom fifth and the top quarter. The “median” sits somewhere in the middle, representing almost nobody.
Lincoln Murphy from Sixteen Ventures makes the point sharply: a 29% conversion rate still means 71 out of 100 signups didn’t buy. The trial period is the part of the funnel you control the most. If 71% of interested people walk away after trying your product, that’s worth investigating.
The PLG paradox
None of the other benchmark articles run this math. Freemium and free trial produce roughly the same number of paying customers per 1,000 website visitors.
Wait, what?
Freemium gets way more signups: about 9% of visitors sign up (vs. 5% for free trial). But freemium converts those signups at a lower rate (3–5% vs. 8–12%). Run the end-to-end math:
- Freemium: 1,000 visitors, 90 signups, ~5 paying customers
- Free trial: 1,000 visitors, 50 signups, ~5 paying customers
Similar outcome. Different path. The model you choose affects how you grow (virality vs. urgency), not necessarily how many paying customers you get per visitor.
Kyle Poyar (who co-authored the ChartMogul report) puts it well: a 3% rate can be perfectly fine if you have high traffic, low acquisition cost, and strong expansion revenue. A 15% rate can be a disaster if your traffic is expensive and customers churn after three months.
What to look at instead
Real-world examples make this concrete:
- Dropbox (S-1 filing, 2018): 500 million registered accounts, 11 million paying. That’s ~2.2%. The company was worth $12 billion.
- Spotify (Q4 2024 earnings): 675 million monthly active listeners, 263 million premium. That’s ~39%. Wildly different denominator.
The conversion rate number means nothing without context. What’s being measured? Over what period? What does the business model look like underneath? For a broader look at what a good conversion rate looks like across industries, we break that down separately.
Track the CRO metrics that matter for your specific model. And track the trend over time, not just the snapshot.
How to improve your SaaS conversion rate
Benchmarks tell you where you are. Now, what do you do about it?
Pick the funnel stage that matters most
For freemium, the biggest lever is usually visitor-to-signup. Your landing page, pricing page, and signup flow matter more than what happens inside the product (at first).
Free trial? Focus on trial-to-paid. That means onboarding, time-to-value (how fast someone sees what your product actually does), and activation.
ProductLed found that only 34% of SaaS companies even track activation. If you’re not measuring that “aha moment,” you’re flying blind.
Sales-led is all about the handoff. Form fill to booked meeting to closed deal. Every stage has its own conversion rate, and they multiply. A 10% improvement at any stage compounds.
Shorten the path to value
The faster someone sees why your product matters, the more likely they convert. This sounds obvious. But most SaaS onboarding flows start with “complete your profile” and “invite your team” instead of showing the thing people came for.
Skip the setup ceremony. Get people to the value.
Test your signup and onboarding
Your signup page is probably the most important page on your site. A headline change, a different form layout, removing one field. These small changes can move your signup rate by 10–30%.
Unbounce’s 2024 data across 57 million conversions: SaaS landing pages convert at a median of 3.8%. The top 25% hit 11.6%. That gap is your opportunity. For a broader look at SaaS landing page conversion rate benchmarks alongside other industries, we break those numbers down separately.
Kirro lets you test changes to your signup pages without writing code or waiting on a developer. Point at the element, change it, see which version wins. That’s how you close the gap between “average” and “top quartile.”
For B2B conversion rate optimization, the signup flow is usually where the biggest gains hide. Our CRO best practices guide covers the testing process step by step. New to all this? Start with what CRO is.
Track what happens inside the product
We mentioned PQLs earlier. If you’re not tracking product usage during the trial, start. The companies that use PQLs see 3x higher conversion (ProductLed data). That’s not a marginal improvement. That’s a different business.
Even simple signals help: Did they complete the core action? Did they come back on day 2? Did they invite someone? These tell you who’s engaged and who’s going through the motions.
If your conversion funnel has a clear drop-off point, that’s your testing target. Our funnel conversion benchmarks break down what to expect at each stage across B2B and B2C models. Say 60% of trial users never complete the core action. Set up a test on that onboarding flow and see if you can move the number. Set a clear conversion goal and measure against it.
FAQ
What is a good SaaS conversion rate?
It depends on your model. For freemium self-serve: 3–5% free-to-paid is good, 6–8% is great (Lenny/OpenView/Pendo, 1,000+ products). For free trial without a credit card: 4–6% is good, 10–15% is great (ChartMogul 2026, 200 products). For free trial with a credit card required: 25–35% is good, 50–60% is great. The model type matters more than the number itself. A 3% freemium rate can be healthy if you have high volume and low acquisition cost. A 15% trial rate can be a problem if those customers churn fast.
What is a good free trial to paid conversion rate?
Without a credit card required: 4–6% is good, 10–15% is great. With a credit card: 25–35% is good, 50–60% is great. Opt-out trials (where you auto-charge unless canceled) show 48.8% vs. opt-in trials at 18.2% (First Page Sage, 86 companies). The credit card question is really a top-of-funnel question: requiring a card filters out casual signups, giving you higher conversion but fewer total trials.
How do B2B and B2C SaaS conversion rates compare?
B2B SaaS typically benchmarks 8–15% trial-to-paid depending on model type. B2C subscription products tend to show higher raw percentages because they more often require a credit card upfront (opt-out model). But B2C also sees higher churn. Recurly’s data (heavy B2C) showed 50% median trial-to-paid in 2023, dropping to 34% by 2025. The B2C number looks better on paper but can mask retention problems. For B2B specifically, your click conversion rate from ads to signup is another metric worth tracking alongside trial conversion.
Does requiring a credit card for free trials help or hurt?
Both. It dramatically increases trial-to-paid conversion (25–35% vs. 4–6%) because you’ve filtered out everyone who isn’t serious. But it reduces visitor-to-trial signup rate just as dramatically. The net effect on absolute paying customers depends on your traffic volume. If you get 100,000 monthly visitors, a no-card trial might produce more paying customers total. If you get 5,000, requiring a card might be smarter because you need every trial user to count. There’s no universal right answer. Test both if you can. You can use our conversion rate calculator to model the math for your traffic.
Are SaaS trial conversion rates declining?
Data says yes. Recurly’s platform-wide data shows trial-to-paid dropping from 50% to 34% median between 2023 and 2025. That’s a 32% decline. Mixpanel’s 2024 report backs this up with Week 1 retention dropping from 50% to 28% across all industries. People sign up for more things and commit to fewer. If your conversion rate dropped in the last two years, check the industry trend before blaming your product. The benchmark moved, not just your numbers.

Randy Wattilete
CRO expert and founder with nearly a decade running conversion experiments for companies from early-stage startups to global brands. Built programs for Nestlé, felyx, and Storytel. Founder of Kirro (A/B testing).
View all author posts