What is CVR (conversion rate)?
You’ve probably seen “CVR” in your Google Ads dashboard, a marketing report, or a blog post and wondered what it meant. Simple answer: it’s just the abbreviation for conversion rate.
The formula looks like this:
CVR = (Conversions ÷ Total interactions) × 100
If 1,000 people click your ad and 30 of them buy something, your CVR is 3%. That’s it. (Want the full math for different business models? See our guide on how to calculate conversion rate.)
But “conversions” and “interactions” are slippery words, and conversion rate benchmarks vary wildly across platforms. A conversion could be a purchase, a signup, an app install, or a form submission. And interactions could mean clicks, video views, page visits, or something else entirely.
The definition changes depending on which platform you’re looking at. And that’s where it gets frustrating.
The CVR formula (and why one formula isn’t enough)
The math is always the same: conversions divided by interactions, times 100. Easy.
The problem is what counts as an “interaction.” Google Ads includes video views and phone calls. Meta counts link clicks. TikTok has its own definition. So when you compare your conversion rate (CVR) across platforms, you’re comparing apples to avocados.
Each platform defines it differently:
| Platform | CVR formula | What “interactions” means |
|---|---|---|
| Google Ads | Conversions ÷ Interactions × 100 | Clicks, video views, calls, map actions |
| Meta/Facebook | Conversions ÷ Link Clicks × 100 | Link clicks (default reporting) |
| TikTok Ads | Conversions ÷ Ad Interactions × 100 | Clicks plus 6-second video views |
| Apple Search Ads | Installs ÷ Taps × 100 | Taps on App Store listing |
| Your website (GA4) | Conversions ÷ Sessions × 100 | Individual browsing sessions |
Same campaign. Same ad. Five different CVR numbers. If that feels confusing, it’s because it is. But knowing this saves you from comparing numbers that were never meant to be compared.
Our take: When someone asks “what’s your CVR?” the only honest answer is “on which platform?” A 3% CVR in Google Ads and a 3% CVR on your website are measuring completely different things.
How each ad platform calculates CVR
This is the part every other CVR definition skips. They show you one formula and call it a day. But if you actually run ads, you know the numbers never match up across platforms.
Google Ads
Google uses “interactions” as the denominator. That includes clicks, but also video views, phone calls, and map directions. So if someone watches your YouTube ad and later buys from your site, that counts.
It gets weirder. Google Ads CVR can go above 100%. Say you’re tracking “every” conversion, not just one per click. One click, two purchases? Your CVR is 200%. Not broken. Just how Google counts.
Google also reports conversions back to the click date, not the purchase date. A click on March 1st that converts on March 10th shows up in your March 1st data. Keep that in mind when you’re figuring out what worked this week.
Meta (Facebook and Instagram)
Meta’s default setup includes view-through conversions (crediting an ad even when nobody clicked it). Someone sees your ad, doesn’t click, but buys within 24 hours? Meta credits the ad anyway.
The default attribution window is 7-day click, 1-day view. Clicks get a week. Views get one day.
This inflates your CVR compared to click-only platforms. Want an apples-to-apples comparison with Google Ads? Switch your Meta reports to “7-day click only.” The numbers will drop, but that’s a more honest picture.
For deeper platform-specific numbers, see our full guide on Facebook Ads conversion rate.
TikTok Ads
TikTok has a unique twist. If someone watches your ad for 6+ seconds without clicking, and later converts, TikTok still counts it. They call this Engaged View-Through Attribution (EVTA).
TikTok’s own research found that click-only attribution undervalues TikTok conversions by 73%. That’s a huge gap. Whether it reflects real influence or generous counting depends on who you ask.
Apple Search Ads
Apple measures taps (not clicks) and installs (not purchases). Branded search terms (people searching for your app by name) convert at 45-65%. Completely different scale from web CVR.
If someone tells you their CVR is 50%, ask if they’re running Apple Search Ads before you get jealous. For more on app-specific numbers, see our guide on mobile app conversion rate.
Amazon Ads
Amazon’s attribution window defaults to 14 days. And it counts purchases of any product in your brand, not just the one you advertised. Someone clicks an ad for your phone case and buys your screen protector instead? That’s a conversion.
This “brand halo” effect tends to push Amazon CVR higher than what you’d see on Google or Meta for the same products.
What is a good CVR?
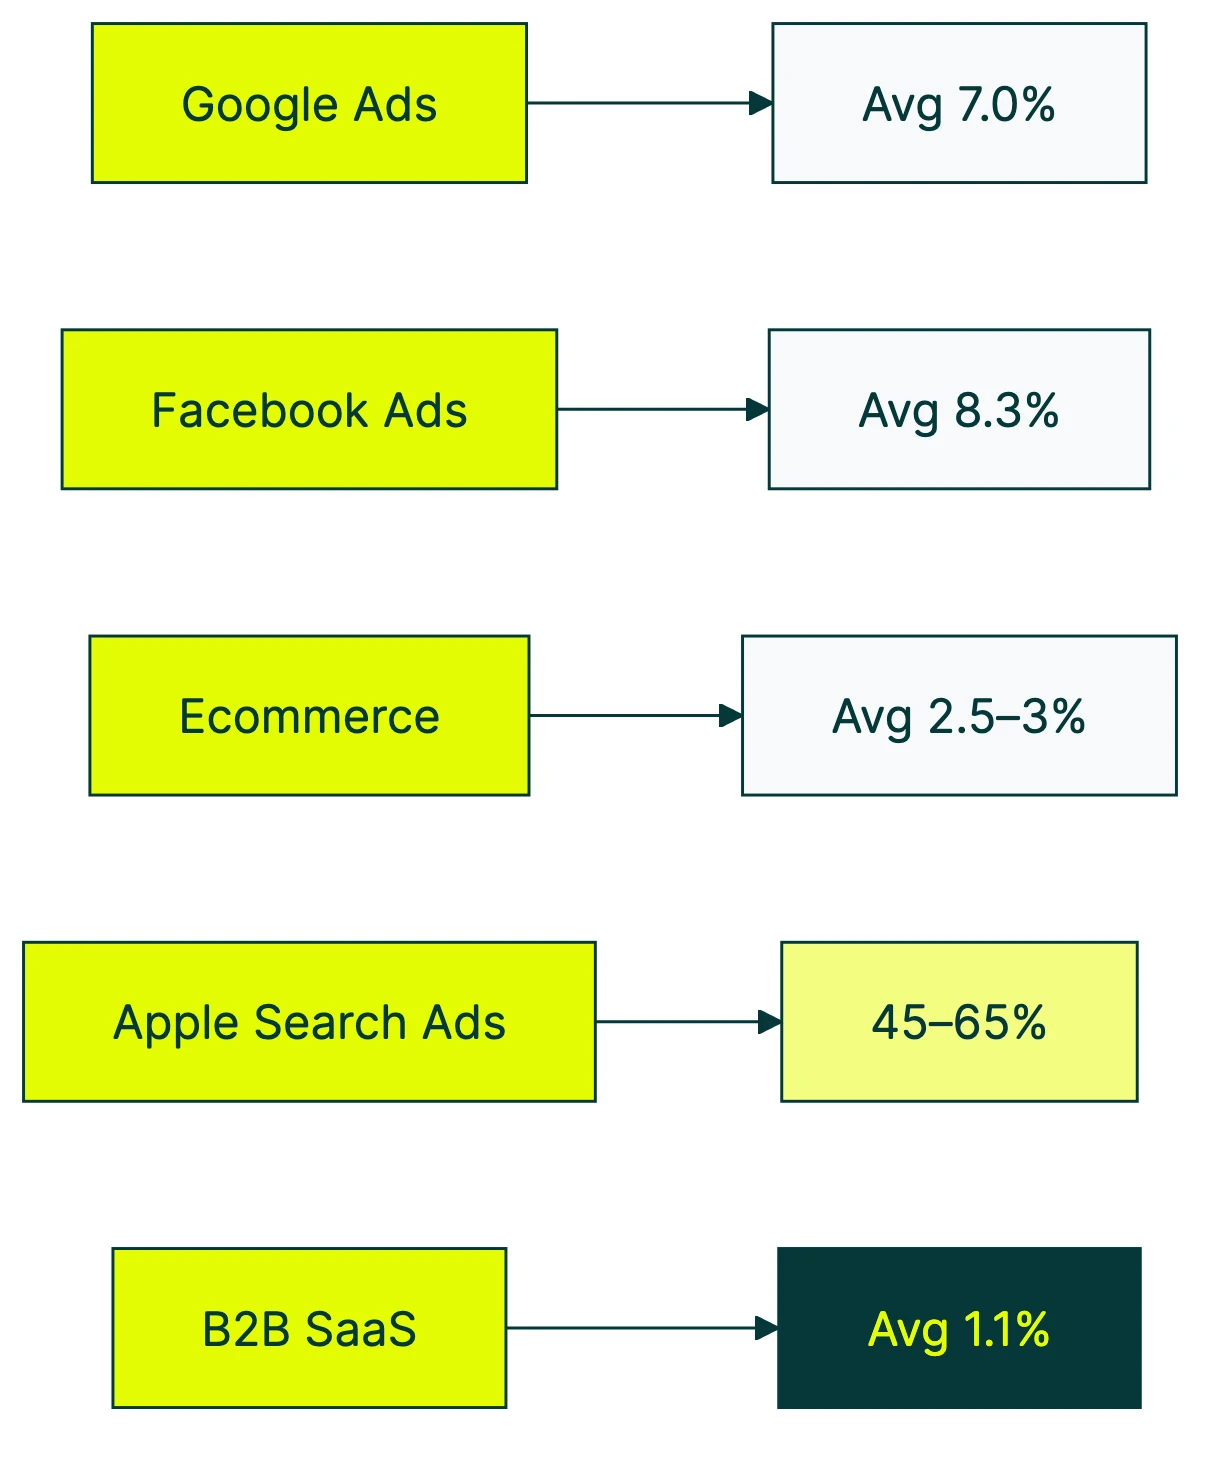
Quick reference ranges to orient yourself:
| Platform / Channel | Average CVR | Source |
|---|---|---|
| Google Ads (all industries) | 7.04% | WordStream 2025 |
| Facebook Ads (all industries) | 8.25% | WordStream 2025 |
| Ecommerce websites (global) | 2.5-3% | Industry composite |
| Apple Search Ads (branded) | 45-65% | SplitMetrics 2025 |
| B2B SaaS websites | 1.1% | First Page Sage 2026 |
For detailed breakdowns by industry and platform, check our full post on what is a good conversion rate. If you’re in software, our SaaS-specific conversion benchmarks break down rates by funnel stage, pricing model, and traffic source.
CVR alone doesn’t tell you if you’re making money.
A 1% CVR on $50,000 enterprise software is wildly profitable. A 5% CVR on a $5 product might not cover your ad spend. The metric that actually matters is revenue per visitor (RPV). It combines your conversion rate with your average order value. CVR is a diagnostic tool. RPV is the scorecard.
Our take: Benchmarks are useful for context, not goals. If your CVR is “below average” but your revenue is growing, don’t panic. If your CVR is “above average” but you’re losing money, the benchmark lied to you.
CVR vs other marketing metrics
CVR doesn’t live in a vacuum. Here’s how it connects to the other abbreviations in your dashboard.
CVR vs CTR (click-through rate). CTR measures how many people clicked your ad out of everyone who saw it. CVR measures how many of those clickers actually converted. High CTR plus low CVR? Your ad is attractive but your landing page doesn’t deliver. That disconnect is worth investigating with a click conversion rate analysis.
CPA (cost per acquisition) tells a different story. You can have a great CVR and still lose money if each conversion costs more than it’s worth. A 10% CVR with a $200 CPA on a $50 product is a fast way to go broke.
Then there’s ROAS, or how much revenue you earn for every dollar spent on ads. CVR ignores revenue entirely. A 2% CVR generating $200 orders beats a 10% CVR generating $5 orders every time.
When to focus on CVR: when your traffic quality is already decent and you want to squeeze more from what you’ve got. If CVR is high but revenue is flat, look at traffic volume and average order value instead. A/B testing shows you exactly how much your CVR changes when you tweak a page element. No more guessing. Tools like Kirro track this automatically. For more on which CRO metrics to track, we’ve got a full breakdown.
How to improve your CVR
This section stays short on purpose. Improving conversion rates is a deep topic. We’ve written full guides on conversion rate optimization and how to improve your conversion rate. But here are five quick wins that work across industries.
1. Match your landing page to your ad copy. If your ad says “free shipping on orders over $50” and your landing page doesn’t mention it, people bounce. Message match sounds obvious, but it’s the most common disconnect we see.
2. Speed up your pages. Portent’s research found that a page loading in 1 second converts 2.5x more than one loading in 5 seconds. Every second counts. Literally.
3. Cut form fields. Baymard Institute found that the average checkout has 23 form fields. The ideal number is 12-14. Every extra field is a chance for someone to say “forget it” and leave.
4. A/B test your calls to action. The button text, the color, the placement. Small changes to your call-to-action button can shift CVR by double digits. Kirro lets you set up a test in a few minutes and see which version actually wins.
5. Segment your CVR by traffic source. Your overall CVR is an average that hides a lot. Email traffic might convert at 15%. Social might convert under 1%. Paid search sits somewhere in between. Knowing which sources actually convert helps you spend smarter. Check your conversion funnel to spot where people drop off. You can also run a quick test with Kirro on your highest-traffic pages to see what moves the needle.
FAQ
What does CVR stand for?
CVR stands for conversion rate. It’s the abbreviation used in advertising dashboards (Google Ads, Meta Ads, TikTok Ads) and marketing reports. You’ll also see it in analytics tools and industry articles. There’s no difference between “CVR” and “conversion rate.” Same metric, shorter label.
Is CVR the same as conversion rate?
Yes. CVR is just the abbreviation. Some platforms use “CVR” in their interface (common in mobile and app advertising), while others spell out “conversion rate” or use “Conv. rate.” They all mean the same thing: the percentage of interactions that resulted in a conversion.
How do you calculate CVR?
Divide your conversions by total interactions, then multiply by 100. If you got 50 conversions from 1,000 clicks, your CVR is 5%. The tricky part is defining “interactions” correctly for your platform. Google Ads counts video views and calls. Meta counts link clicks. Your website analytics probably uses sessions. Use a conversion rate calculator if you want to double-check your math.
What is a good CVR for Amazon ads?
Amazon advertising CVR varies by category. Electronics might see 5-10%, while consumables can reach 15-20%. Amazon’s 14-day attribution window and brand-halo effect (counting any purchase from your brand, not just the advertised product) tend to show higher CVRs than Google or Meta for the same products.
Why is my CVR different in Google Ads vs Google Analytics?
Google Ads attributes conversions back to the click date and can include view-through conversions. GA4 uses session-based attribution with a different conversion model. The same purchase can show up on different dates in different reports. Neither is wrong. They’re just measuring from different angles. For a full walkthrough, see our guide on ecommerce conversion rate in Google Analytics.
Can your CVR be over 100%?
Yes, in Google Ads. If you’re tracking “every” conversion (not “one” per interaction) and a single click leads to multiple purchases, your CVR exceeds 100%. It sounds broken but it’s working as designed. If you only want one conversion counted per click, switch your goal conversion rate tracking to “one” instead of “every.”

Randy Wattilete
CRO expert and founder with nearly a decade running conversion experiments for companies from early-stage startups to global brands. Built programs for Nestlé, felyx, and Storytel. Founder of Kirro (A/B testing).
View all author posts