What is a mobile app conversion rate?
The average mobile app conversion rate depends on which stage you’re measuring. On the App Store, about 25% of page visitors download the app. On Google Play, it’s 27.3%. Those are the numbers you’ll see everywhere.
But that’s only the first step. What happens after the install matters way more.
An app conversion rate tracks what percentage of people complete a desired action at each stage of the funnel. The formula is straightforward: (people who completed the action ÷ total people at that stage) × 100. A shopping app might track installs, account signups, product views, and purchases. Each of those is a separate conversion rate.
Most articles treat “mobile app conversion rate” like it’s one number. It’s not. It’s four numbers, and mixing them up is why so many benchmarks feel useless. A 25% store conversion rate and a 1.7% download-to-subscriber rate are both “app conversion rates.” But they tell you very different things.
If you’re trying to figure out what counts as a good conversion rate, you need to know which stage you’re actually asking about. For broader conversion rate benchmarks across web and mobile, we cover those separately. And the conversion rate optimization playbook changes depending on which stage you’re fixing. Let’s break them all down.
Average app conversion rate by category
These are app store conversion rate benchmarks. They measure how many people who view your listing actually download the app. Data comes from AppTweak’s H1 2024 US market study.
| Category | iOS (App Store) | Google Play |
|---|---|---|
| Finance | 32.8% | 19.7% |
| Music | 47.1% | 34.6% |
| Shopping | 27.7% (est.) | 27.7% |
| Health & Fitness | 23.2% (est.) | 23.2% |
| Auto & Vehicles | N/A | 60-70% |
| Utilities | 36.8% (est.) | 36.8% |
| Games (Board) | 1.2% | 7.3% |
| Overall average | 25% | 27.3% |
A few things stand out. Games convert terribly at the store level because there are millions of them. Finance apps convert well because people searching for a banking app usually know exactly what they want.
And yes, some iOS categories show conversion rates over 100%. Navigation apps hit 115.5%. That’s not a typo. Apple counts downloads from search results (people who never visit the app page), which throws off the math. Most articles just quote the number without explaining why.
Our take: These store-level benchmarks are table stakes. Everyone publishes them. But they only measure the first step. Knowing your store conversion rate is like knowing how many people walked into a restaurant. It tells you nothing about whether they ordered.
For a deeper look at store listing performance specifically, see our guide to app store conversion rate benchmarks.
The four conversion stages that actually matter
Most mobile conversion rate articles stop at “store page to install.” That’s stage one of four. The full picture of how conversion funnels work for mobile apps looks like this:
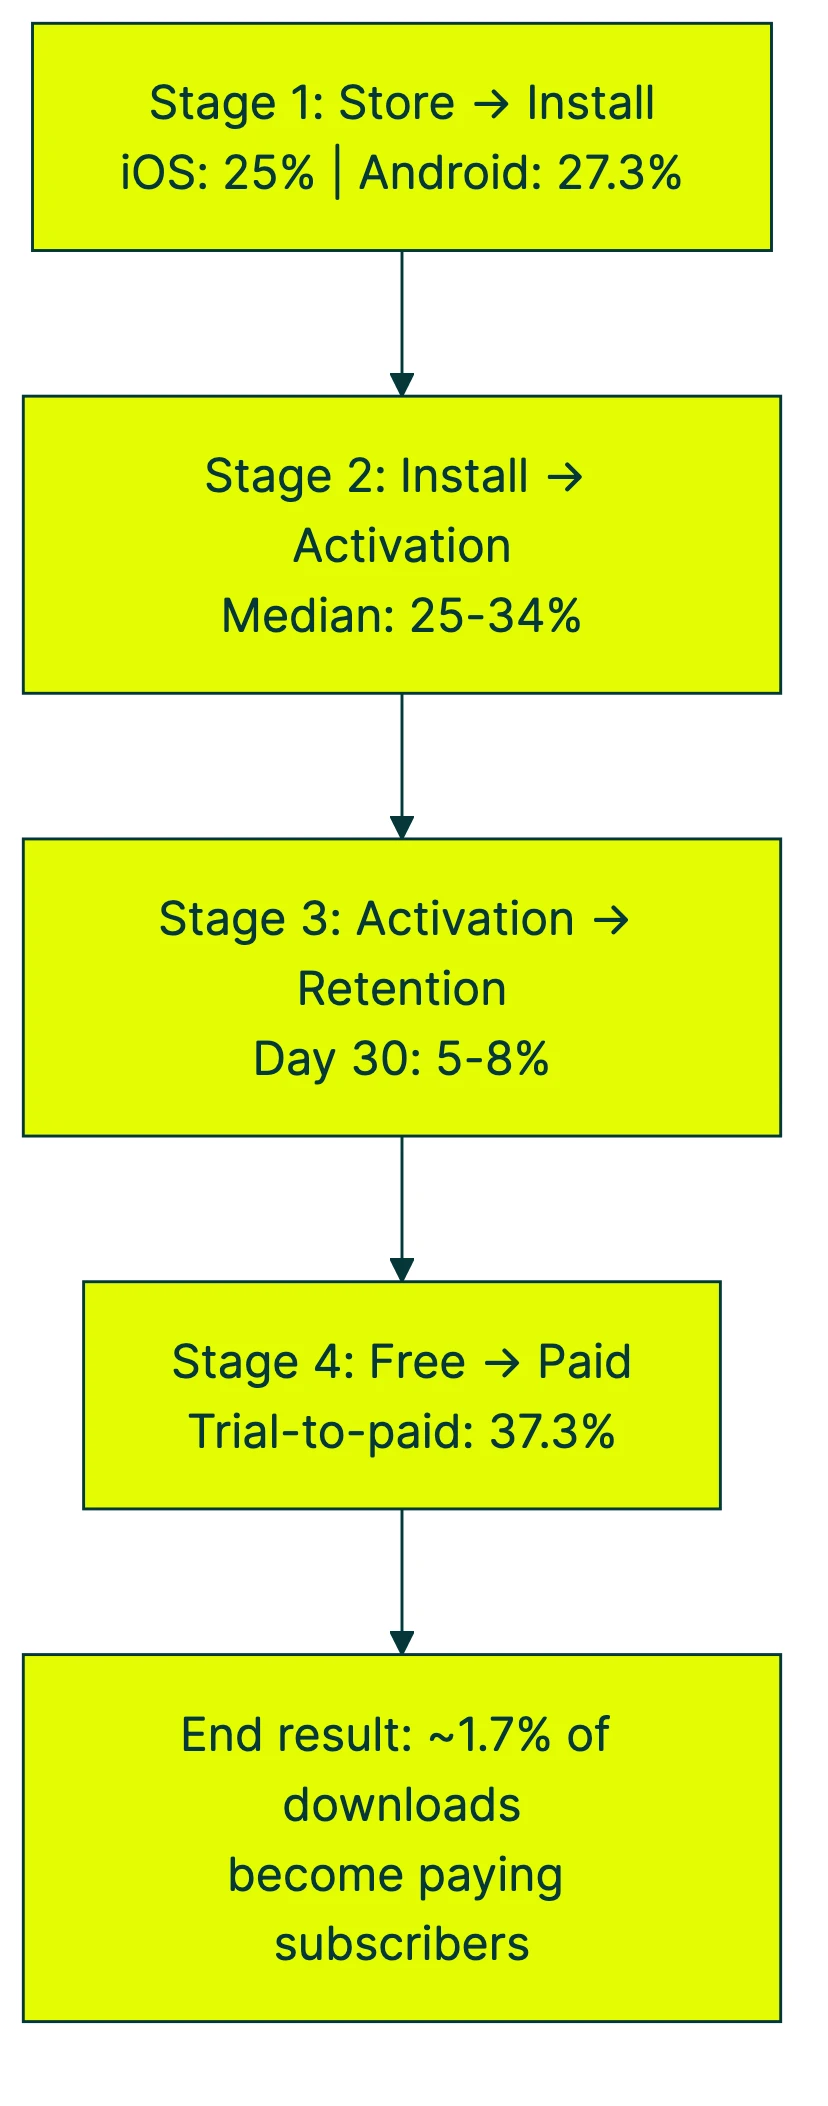
Nobody shows you the full funnel math. If 1,000 people see your app store page:
- 250 install (25% store CVR)
- 85 activate (34% activation rate)
- 6 are still around on Day 30 (7% retention)
- 2 become paying subscribers (37.3% trial-to-paid)
Two out of a thousand. That’s the real mobile app conversion rate for subscription apps, based on RevenueCat’s 2025 data across thousands of apps.
That 1.7% might sound depressing. But it’s actually the useful number because it tells you where the leaks are. A store conversion rate of 25% means nothing if 98% of your installers never come back.
Each stage has its own category-level benchmarks.
Stage 1: store listing to install
The store benchmarks in the table above cover the page-view-to-download rate. But there’s a second metric worth knowing: the install rate. It tracks people who download directly from search results without ever opening your listing page.
The overall US install rate on the App Store is just 3.8% (AppTweak). Medical apps lead at 16.3%. Games sit at 0.6%.
If you’re running paid ads, the metric to watch is IPM, or installs per thousand ad impressions. Think of it as “how well do my ads convince people to download.” Adjust’s 2024 data puts the global median at 4.27 IPM, with North America leading at 6.23.
There’s an interesting paradox in the data. Finance apps have one of the lowest IPMs (1.21) but one of the highest page conversion rates (32.8% on iOS).
The reason? Finance users don’t respond well to broad ad campaigns. But when they search for a specific banking app and land on the page, they’re ready to download. High intent, low ad-driven installs.
The factors that move Stage 1 numbers are your app icon, screenshots, description, ratings, and click conversion rate on ads. We won’t go deep on how to improve them here. That’s the territory of app store optimization.
Stage 2: install to activation
Activation means the moment a person does the thing your app was built for. Not just opening the app. Not just creating an account. Actually doing the core thing. For a fitness app, that might be logging a workout. For a finance app, connecting a bank account. For a photo editor, editing a photo.
The median activation rate across all apps is about 25%, with an average around 34% (Plotline, December 2024). B2C apps with free trials see onboarding completion rates of 30-50% (InnerTrends).
Those numbers sound okay until you read the fine print. Amplitude analyzed 2,600+ companies. They found that for half of all products, 98% of new people are inactive by Day 14. Half. That’s not a rounding error. That’s most apps losing nearly everyone within two weeks.
This stage matters more than any other. 69% of apps with strong Day 7 activation also had strong 3-month retention. Activation predicts long-term success better than store conversion rates, ad spend, or download volume.
Our take: If your activation rate is below 25%, stop worrying about your store listing. Your store is fine. Your onboarding is the problem. The best investment you can make is A/B testing your onboarding flow to get more people to their first meaningful action.
Tools like Kirro let you test different onboarding flows to see which one gets more people to that first key action. Change the welcome screen, reorder the setup steps, simplify the first task. Small changes here compound through every stage that follows.
Stage 3: activation to retention
Retention tracks the percentage of people who return to your app after their first use. The standard checkpoints are Day 1, Day 7, and Day 30. Did they come back tomorrow? After a week? Are they still around after a month?
Benchmarks by category, compiled from Sendbird, Statista, and OneSignal:
| Category | Day 1 | Day 7 | Day 30 |
|---|---|---|---|
| Banking/Finance | 30.3% | 17.6% | 11.6% |
| Marketplace (Amazon, eBay) | 33.7% | 16.1% | 8.7% |
| Social Media | 26.3% | 9.3% | 3.9% |
| Shopping | 24.5% | 10.7% | 5.6% |
| Entertainment | 22% | 8.2% | 3.8% |
| Health & Fitness | 28% | — | 3.5% |
| Gaming (casual) | 32.2% | 7.9-12.6% | 2.3-5.4% |
| Food & Drink | 16.5% | — | 3.9% |
| Cross-industry average | 25-28% | 12-18% | 5-8% |
Banking apps win at Day 30 because people check their bank account constantly. Gaming apps lose because people get bored. This makes intuitive sense. How often you need something determines how often you return to it.
A few data points that put these numbers in context:
- The 7% rule: Getting 7% Day 7 retention puts you in the top 25% of all products (Amplitude). That’s a low bar, which tells you how bad most apps are at keeping people around.
- iOS retains better than Android: Day 30 retention is 8% on iOS vs. 6% on Android (Adjust). Probably because iOS customers tend to be more intentional about what they download.
- Retention is falling industry-wide: Mixpanel’s 2024 report found that Week 1 retention dropped from 50% to 28% between 2022 and 2023. That’s a massive decline in one year. More apps, more competition, shorter attention spans.
The CRO metrics that matter for retention are different from store-level metrics. Here it’s about time-to-value, push notification strategy, and feature stickiness.
Stage 4: free to paid
This is where the money lives. RevenueCat’s State of Subscription Apps reports cover thousands of apps. And the data contradicts a lot of common advice.
The basics:
- 3.7% of downloads start a free trial (median across all categories)
- 37.3% of trials convert to paid (2024 data, down from 40.5% in 2023)
- Combined: ~1.7% of all downloads become paying subscribers
- Top 10% of apps achieve a 20.3% trial start rate, more than 3x the median
By category (trial-to-paid conversion):
| Category | Trial-to-paid rate |
|---|---|
| Travel | 54.3% |
| Shopping | 45.4% |
| Health & Fitness | 44.5% |
| Gaming | 30.8% |
| Photo & Video | 26.2% |
For free trial conversion benchmarks across other industries, including SaaS conversion rate benchmarks, the numbers look different. A lot depends on whether the trial requires a credit card upfront.
The timing insight nobody talks about:
This is the data point that surprised us most. 82% of all trial starts happen on Day 0, the same day the person installs the app. For utility apps, it’s 86%.
That flips the conventional wisdom. Many app makers think they should let people explore the app for a few days before showing a paywall. “Don’t scare them off.” But the data says the opposite. If someone is going to start a trial, they’ll almost always do it on day one. Wait until day three, and you’ve already lost most of your potential subscribers.
That doesn’t mean you should throw a paywall in their face before they’ve seen the app. It means the window for converting free users is much smaller than most people assume. Get to the value fast, then make the ask.
Subscription type matters too. Weekly subscriptions lose two-thirds of subscribers by month four. Monthly plans retain 52% after three renewals. Annual plans retain best. If your conversion rate metrics look great on Day 1 but revenue keeps falling, your subscription cadence might be the problem.
And whether your trial requires a credit card upfront changes everything. Trials that don’t require a card (opt-in) convert at about 25%. Trials that do require a card (opt-out) convert at 48-60%. The trade-off: opt-out trials get fewer starters but much higher conversion rates.
How to find which stage is leaking
Knowing how to increase app conversion rate starts with figuring out where you’re losing people. Quick diagnostic:
Step 1: Measure your conversion rate at each stage. You’ll need analytics tools like Amplitude, Mixpanel, or AppsFlyer. Set up these four numbers:
- Store page visitors → installs
- Installs → activation (first key action)
- Activated users → Day 30 retention
- Active users → paid subscribers or purchasers
Step 2: Compare to the benchmarks. The stage where your number is furthest below the benchmark is your biggest leak.
Step 3: Diagnose the pattern.
Common patterns and what they mean:
- Strong store CVR, weak activation = your store listing is doing its job, but your onboarding is confusing or slow. Focus on simplifying the first experience.
- Strong activation, weak retention = people get the initial value but don’t form a habit. Your app might solve a problem once but not daily.
- Strong retention, weak paid conversion = loyal users who won’t pay. Your paywall timing, pricing, or value proposition for the paid tier needs work.
Step 4: Fix the biggest leak first. Fixing Stage 2 (activation) almost always has the highest return because improvements compound through stages 3 and 4. A 10% improvement in activation lifts retention and paid conversion automatically.
Once you know which stage needs work, run a test with Kirro. Change one thing, measure the result. For detailed tactics on improving each stage, check out our guide to improving your app conversion rate.
If you’re using GA4 to track conversion rates, make sure you’re measuring events at each funnel stage, not just overall install counts.
Why benchmarks can be misleading
Before you panic about your numbers, a reality check on these benchmarks.
The survivorship problem. There are roughly 4 million apps on the App Store and Google Play combined. Most of them are abandoned, barely maintained, or have fewer than 100 downloads. A benchmark saying “average Day 30 retention is 7%” includes millions of zombie apps. They drag the number down for everyone.
RevenueCat’s 2025 data makes this stark: the top 5% of newly launched apps generate 200x more monthly revenue than the bottom quartile after one year. Two hundred times. That’s not a bell curve. That’s a cliff.
Your traffic source changes everything. The same app can show 25% install conversion from organic search and 5% from paid ads. Apple Search Ads users generate roughly 10x the revenue of average users. Category benchmarks hide this completely.
The methodology problem. Mixpanel, Adjust, AppsFlyer, and Statista all publish different numbers for the same time periods. Mixpanel says Week 1 retention dropped to 28%. OneSignal says Day 7 retention is 17.86%. Adjust says Day 30 is 7%. These aren’t necessarily contradictions. They’re measuring slightly different things with different definitions of “active.”
So what should you do with benchmarks? Use them as directional references, not targets. Track your own numbers over time. A 2% improvement in your own Stage 2 conversion is worth more than hitting some industry average. If you’re setting conversion rate goals, base them on your own trajectory, not someone else’s average.
Building a broader CRO strategy? Start with understanding what conversion rate optimization actually is, then use these benchmarks as a reality check, not a report card.
FAQ
What is a good mobile app conversion rate?
It depends on which stage you’re measuring. For store page to install, 25-30% is average (iOS and Android). For install to activation, above 25% is median. For Day 30 retention, above 7% puts you in the top 25%. For trial to paid, above 37% is current median. The combined download-to-paying-subscriber rate across all stages is about 1.7%.
How do you measure app conversion rate?
Track four stages separately. Store listing views to installs. Installs to activation (first key action). Activated users to retained users (Day 1/7/30). And retained users to paid subscribers. Use analytics tools like Amplitude, Mixpanel, or AppsFlyer to measure each stage. The formula is always (people who completed the action ÷ total people at that stage) × 100. You can also test variations at each stage to improve your numbers.
What is a good conversion rate on the App Store?
The US average is 25% page-view-to-install (AppTweak, H1 2024). But it varies wildly by category. Finance apps convert at 32.8%. Music apps at 47.1%. Board games at just 1.2%. Some navigation apps exceed 100% due to a quirk in how Apple measures installs from search results. For a full breakdown, see our app store conversion rate guide.
Is a 2.5% conversion rate good?
Context is everything. For install-to-purchase in retail apps, 2.5% is above the 1.39% industry benchmark and quite strong. For app store page-to-install conversion, 2.5% would be alarmingly low (average is 25%). For download-to-paid-subscriber across the full funnel, 2.5% would actually be excellent (average is 1.7%). Always specify which stage you’re measuring.
How do I increase my app conversion rate?
Start by diagnosing which of the four stages is your weakest. Compare your numbers to the benchmarks in this post. The highest-return fix is usually improving activation (Stage 2), because it compounds through retention and paid conversion. Small onboarding improvements can have outsized effects on revenue. For detailed tactics at each stage, read our guide on improving your app conversion rate.

Randy Wattilete
CRO expert and founder with nearly a decade running conversion experiments for companies from early-stage startups to global brands. Built programs for Nestlé, felyx, and Storytel. Founder of Kirro (A/B testing).
View all author posts