App conversion rate optimization is the process of getting more people to install your app, use it, and pay for it. That covers two jobs: getting downloads and getting paying customers. Most guides only cover one. This guide covers both.
From the moment someone sees your app in the store to the moment they tap “subscribe.” Every stage has a different conversion rate, different levers, and a different reason people drop off.
If you’re not sure what conversion rate optimization is in general, start there. Our conversion rate optimization guide covers the full picture. This post is specifically about mobile apps, where the rules are a bit different from websites.
The full app conversion funnel (most guides only cover half)
Most app CRO guides focus on app store screenshots and descriptions. Others focus on in-app purchases and subscriptions. Almost nobody maps the whole thing.
Your app’s conversion funnel looks like this:
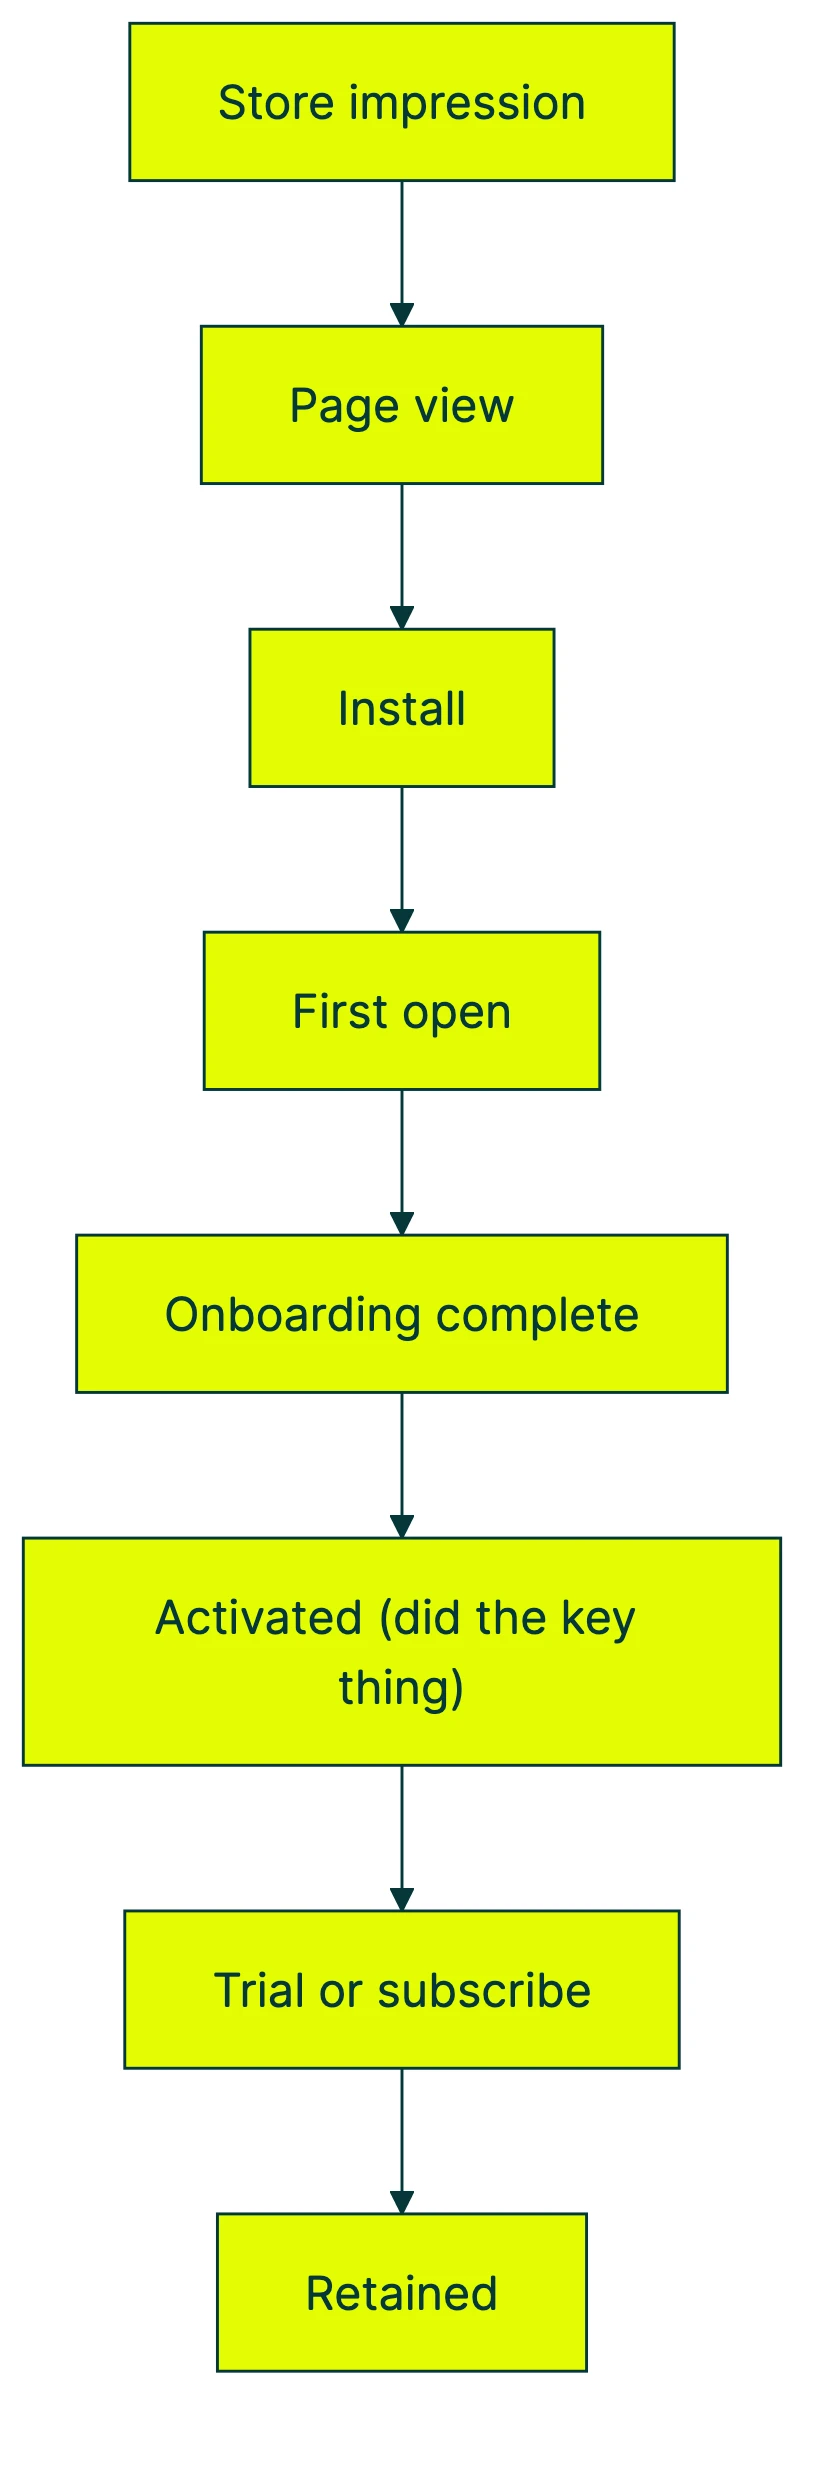
People drop off at every step. A 10% improvement at the store level gets you more installs. A 10% improvement at the paywall gets you more revenue. Both matter, but they need completely different fixes.
Think of it like a restaurant. Getting people through the door (store listing) is marketing. Getting them to order dessert (subscription) is the dining experience. Improving one doesn’t automatically fix the other.
The rest of this post walks through each stage. We’ll start at the store, move through onboarding, and end at the paywall. A full CRO strategy helps you decide where to focus first, and working with CRO services can speed up the process.
Our take: If you’re only working on your app store listing, you’re leaving the bigger revenue levers untouched. The real money is inside the app.
What’s a good app conversion rate? Benchmarks by category
Let’s put some numbers on the table. These come from AppTweak’s H1 2024 benchmark study of the top 1,000 US apps:
| Category | App Store conversion rate | Google Play conversion rate |
|---|---|---|
| Navigation | 115.5% | High |
| Business | 66.7% | High |
| Games (Board) | 1.2% | Low |
| Overall average | ~25% | ~27.3% |
Navigation apps converting at 115%? That means many people who view the listing already have the app and are re-downloading. Context matters.
For in-app conversion (people who download and then pay), the picture looks very different. RevenueCat’s State of Subscription Apps 2025 analyzed 115,000 apps generating $16 billion in revenue:
- Freemium apps (free to use, pay for extras): 2.18% download-to-paid (median)
- Hard paywalls (you must pay before using the app): 12.11% download-to-paid
- Trial-to-paid by category: Travel 48.7%, Media 43.8%
Those numbers are medians. The top performers are significantly higher. If you want a deeper look at mobile app conversion rate benchmarks, we’ve got a separate post with category-level breakdowns. For store listing conversion specifically, our app store conversion rate benchmarks cover iOS and Google Play by category.
The key takeaway: “conversion rate” means different things at different funnel stages. Make sure you’re tracking the right CRO metrics for where your bottleneck actually is.
Improve your app store listing for more downloads
Your app store listing is your landing page. People decide in seconds. The data on what actually moves the needle comes from SplitMetrics’ 2025 Apple Ads benchmarks (3.1 million keywords, 253 million downloads):
Your icon has 22.8% average uplift potential. It’s the one thing every person sees, whether they’re browsing search results or the top charts. Tiny, so clarity beats cleverness.
Screenshots? 21.7% uplift potential. But only 17% of visitors scroll past the first one. Your first two screenshots do almost all the work. Order matters more than design.
Sensor Tower found that simply reordering screenshots (same images, different sequence) drove 6.4% more installs in a 30-day test. And only 1% of people read the full description. Fix your screenshots first. Stop agonizing over your description.
Ratings make a bigger difference than you’d expect. Apps that climb from 3.6 to 4.2 stars see roughly 60% higher conversion rates, according to AppTweak. Small rating change. Big install jump.
Then there’s Custom Product Pages, which are special versions of your store page for different audiences. They boost conversion by 5.9% on average, per AppTweak’s 2025 ASO trends report. Yet 69% of top apps don’t use them. Free improvement, sitting right there.
If your app works in multiple countries, localize your store metadata. 75% of top-performing apps translate titles, descriptions, and screenshots into local languages. Low-hanging fruit.
Our take: Most app teams spend weeks on their description and minutes on their screenshots. The data says do the opposite. Screenshots first, always.
In-app conversion: from install to paying customer
This is where the real money lives. One stat changes everything about how you should think about onboarding.
RevenueCat’s data found something wild. 82% of trial starts happen on Day 0. The day someone installs your app. Not Day 7. Not after a drip campaign. Half of all paid conversions happen that same day too.
Most app CRO guides focus on lifecycle campaigns and push sequences. That stuff matters. But the first session is where most revenue gets decided. Confusing onboarding or a buried paywall? No amount of follow-up messages will fix that.
Onboarding that actually works
Chameleon’s 2025 benchmark report analyzed 550 million+ interactions. Onboarding tours that trigger when someone takes an action hit 67% completion rates. Tours that pop up uninvited? Way lower.
More findings:
- Tours longer than 5 steps see a sharp drop in completion
- Progress indicators (“Step 2 of 4”) improve completion by 12%
- Keep each step under 26 words
OneSignal’s data backs this up: apps with onboarding messages see 24% higher install-to-purchase conversion compared to apps without them.
What about activation, the moment someone gets your app’s core value? Userpilot’s analysis of 547 SaaS companies puts the average at 37.5%. People who complete an onboarding checklist are 3x more likely to become paying customers.
Translation: a simple checklist that guides people to your app’s core value is one of the highest-impact things you can build. If you’re looking for CRO best practices that apply to apps, this is near the top of the list.
Push notifications and in-app messages
Personalized push notifications drive 344% higher engagement than generic ones (OneSignal). But there’s a ceiling. Airship’s 2025 data shows 46% of people opt out at just 2 to 5 messages per week. Less is more.
In-app messages (the ones that appear while someone’s using your app) have a 75% open rate. Push notifications? Roughly 2 to 5%. If you have something important to say, say it inside the app.
The paywall strategy most apps get wrong
This goes against conventional wisdom. The data backs it up.
RevenueCat analyzed 115,000 apps. Apps using hard paywalls (you must pay or start a trial before using the app) generate $2.32 median revenue per install at Day 14. Freemium apps? $0.27. That’s 8.5x more revenue.
By Day 60, the gap gets wider: $3.09 vs $0.38.
This flips the “always let people try for free” narrative. And it’s not just one data source. 86% of AI apps now skip the free trial entirely. Straight to a paywall.
Trial length and pricing
Adapty’s State of In-App Subscriptions 2025 (16,000 apps, $3 billion revenue) found:
- 7-day trials convert at 45.7% trial-to-paid
- 3-day trials convert at 26.8%
- Yet the industry is trending toward shorter trials
Longer trials give people more time to experience value. Shorter trials create urgency. The data leans toward longer, but your specific app might be different.
And higher prices don’t suppress conversion as much as you’d think. High-priced apps convert at 9.8% trial-to-paid vs 4.3% for low-priced (RevenueCat). People who pay more are more committed.
Weekly subscription plans now account for 55.6% of app revenue in 2025 (Adapty). The highest lifetime value combo? Weekly plan + free trial at $49.27 over 12 months. Trial subscribers also retain 1.4 to 1.7x better than direct buyers.
Real examples
One mental health app (Rootd) moved its paywall earlier in the flow. Result: 5x revenue increase. Another app showed the paywall to every person during onboarding instead of hiding it behind a menu. Went from 3% to 15% install-to-trial.
The tradeoff: hard paywalls have a 5.8% refund rate compared to 3.4% for freemium (RevenueCat). More revenue, but more refund requests too.
If you want to test which approach works for your app, CRO testing covers how to structure these kinds of tests properly. For teams just getting started, Kirro lets you test different versions of your in-app experience without writing code.
How to A/B test your mobile app
Mobile app conversion optimization needs testing at every stage.
Store listing tests
Apple offers native A/B testing for your App Store listing. Google Play has store listing experiments. Third-party tools like SplitMetrics and AppTweak offer more flexibility.
AppTweak found that 57% of the top games on Google Play have A/B tested their screenshots at least twice. They’re not guessing. They’re testing. And the ones that test more tend to rank higher.
In-app tests
You can test:
- Onboarding flows (3 steps vs 5 steps, different welcome messages)
- Paywall placement (after onboarding vs after using a feature)
- Pricing and trial length (weekly vs monthly, 3-day vs 7-day trial)
- Feature gating (what’s free vs what’s behind the paywall)
The rule: change one thing at a time. If you change your paywall design AND your pricing AND your trial length, you won’t know which change made the difference. This is one of the classic A/B testing mistakes that burns people.
What to measure at each stage
| Funnel stage | Key metric |
|---|---|
| Store listing | Install rate (impressions to installs) |
| Onboarding | Completion rate |
| Paywall | Trial start rate |
| Subscription | Lifetime value (LTV) |
For paywall and pricing tests, RevenueCat Experiments is solid. Superwall is paywall-specific. Adapty handles subscription testing well. For a full comparison of the best mobile testing tools, we wrote a dedicated guide. And for mobile app A/B testing with a visual editor, Kirro lets you test onboarding flows and feature variations. No developer help needed. Set up a test in a few minutes and see which version wins.
One thing to watch: track A/B testing conversion rates at each funnel stage separately. A change that improves trial starts might hurt retention.
Bayesian A/B testing (math that works with less traffic) gives you faster, more readable results than traditional methods. Worth knowing about if your app isn’t pulling millions of visitors.
The right CRO tools make this easier. And if you’re not sure where your app is leaking conversions, a CRO audit of your funnel is a good place to start.
FAQ
What is app conversion rate optimization?
It’s the work of getting more people to install your app, use it, and pay for it. Two separate jobs: making your store listing more convincing, and making your in-app experience better. Think of it as conversion rate optimization applied specifically to mobile apps.
How do I improve my app conversion rate?
Start with your biggest drop-off point. Store impressions high but installs low? Fix your screenshots and ratings. Installs high but few people pay? Work on onboarding and paywall placement. Most conversions happen in the first session (RevenueCat data), so focus there first.
What is a good app conversion rate?
For store listings: the App Store averages about 25%, Google Play about 27%. For in-app: 2 to 5% download-to-paid is typical for freemium, 12% for hard paywalls. Top performers in Travel and Media hit 45 to 50% trial-to-paid. These are medians from RevenueCat’s 2025 report, so your mileage will vary by category.
How does app CRO fit into your ASO strategy?
ASO (app store optimization) gets your app found. App CRO gets it installed and monetized. Two sides of the same coin. ASO drives visibility through rankings and keywords. CRO turns that visibility into revenue through better screenshots, onboarding, and paywalls. One without the other leaves money on the table.
How can I increase my mobile app conversion rates?
Focus on the first session. 82% of trial starts happen on Day 0. Test your paywall placement (earlier usually beats later). Simplify onboarding to under 5 steps. Use in-app messages instead of push for important prompts. And test one thing at a time. Want to try it? Grab a free A/B testing trial and start with your onboarding flow.
If you’re running a B2B app, B2B conversion rate optimization has its own set of rules worth reading too.

Randy Wattilete
CRO expert and founder with nearly a decade running conversion experiments for companies from early-stage startups to global brands. Built programs for Nestlé, felyx, and Storytel. Founder of Kirro (A/B testing).
View all author posts