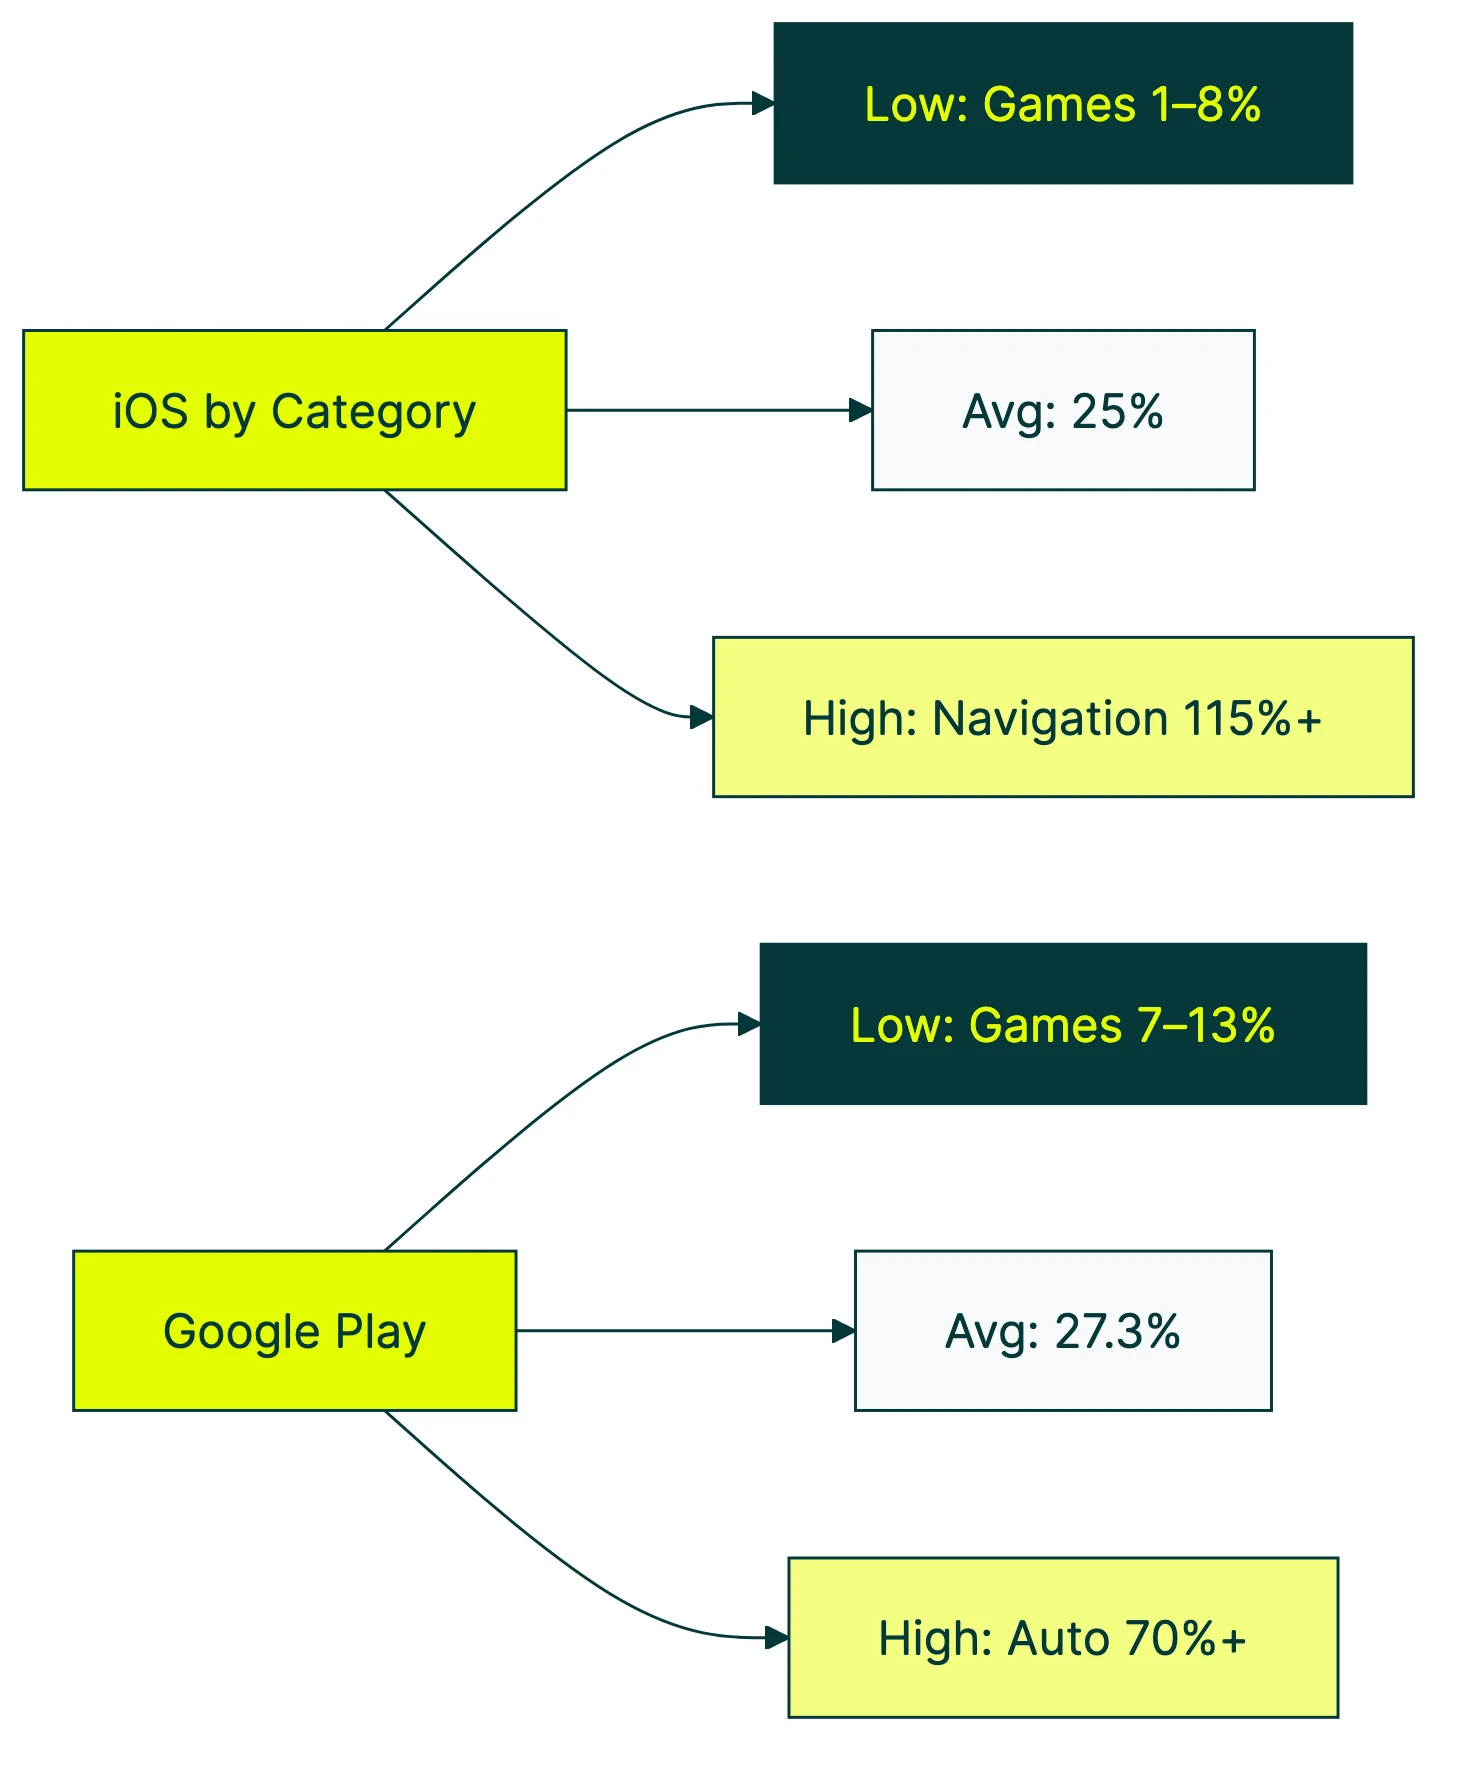
The average app store conversion rate is about 25% on Apple’s App Store and 27.3% on Google Play (AppTweak, H1 2024). That means roughly one in four people who view your store listing actually download the app.
But that number hides a lot. Your category matters. Your traffic source matters. And the tool you use to measure it matters more than most people realize. Apple, Google, and third-party platforms all define “conversion rate” differently. Two dashboards can show you completely different numbers for the same app.
If you want context on what counts as a good conversion rate across channels (not just app stores), start there. Our conversion rate optimization guide covers the broader strategy. For the full mobile funnel from install to paying customer, see our mobile app conversion rate benchmarks.
What is a good app store conversion rate benchmark?
There’s no magic number. “Good” depends on your app category, where your traffic comes from, and which metric you’re actually looking at (more on that mess later).
That said, here’s a rough orientation from our conversion rate benchmarks. The Apple App Store averages about 25% and Google Play about 27.3%. If your category average is 30% and you’re sitting at 15%, you’ve got room to improve. If you’re at 35%, nice work.
For someone who just launched an app: don’t panic if your number is below the average. New apps without reviews or screenshots tend to convert lower. The benchmarks below will tell you what your category specifically looks like, so you’re comparing apples to apples (pun intended).
Our take: Most people obsess over download numbers. But if your store listing converts at 15% instead of 25%, you’re wasting almost half your visibility. Fix the listing before you spend money on ads.
App store conversion rate benchmarks by category
Here are the iOS App Store benchmarks by category, based on AppTweak’s H1 2024 US market data:
| Category | App Store CVR |
|---|---|
| Navigation | 115.5% |
| Weather | 74.0% |
| Food & Drink | 56.5% |
| Finance | 52.3% |
| Business | 48.0% |
| Health & Fitness | 38.2% |
| Social Networking | 35.6% |
| Photo & Video | 31.2% |
| Music | 30.1% |
| Education | 28.4% |
| Shopping | 27.5% |
| Entertainment | 18.7% |
| Lifestyle | 17.9% |
| Games (overall) | 7.8% |
| Board Games | 1.2% |
Wait, 115.5%? How does more than 100% of people convert?
It’s not a typo. Apple counts downloads that happen directly from search results, without the person ever tapping into the full store listing page. So the number of downloads can be higher than the number of page views. The denominator (page views) is smaller than the numerator (downloads). Navigation apps benefit from this heavily because people search “Google Maps,” see the result, and tap download without reading the description.
The huge range across categories makes sense if you think about intent. Someone searching for a finance app usually knows exactly what they want. Someone browsing board games is window shopping through millions of options. High intent means high conversion.
SplitMetrics found similar patterns across 300+ A/B tests. Music apps convert around 32.5%, while individual game subcategories range from 0.87% all the way up to 78.3%.
Important distinction: “conversion rate” (share of page viewers who download) is different from “install rate” (share of all impressions, including people who just scrolled past). The overall install rate from impressions is only about 3.8%. Much bigger funnel, much smaller number.
Google Play Store conversion rate benchmarks
Here are the Google Play benchmarks from the same AppTweak H1 2024 dataset:
| Category | Google Play CVR |
|---|---|
| Auto & Vehicles | 70.5% |
| Maps & Navigation | 55.2% |
| Food & Drink | 50.1% |
| Weather | 48.3% |
| Finance | 42.7% |
| Business | 39.1% |
| Health & Fitness | 33.5% |
| Social | 30.8% |
| Shopping | 29.4% |
| Education | 26.1% |
| Entertainment | 20.3% |
| Photography | 19.5% |
| Lifestyle | 16.8% |
| Games (overall) | 12.5% |
| Board Games | 7.3% |
Auto & Vehicles leads on Google Play at 70.5%. That category barely registers on iOS. The difference comes partly from how Android is used globally. More auto-related apps exist in markets with heavy Android adoption. Google also defines its categories differently than Apple.
Google Play Console gives you something Apple doesn’t: 25th, median, and 75th percentile peer comparisons. You can see exactly where you fall relative to similar apps. That’s genuinely useful.
One problem. Gummicube’s analysis points out that the default peer groups in Play Console are too broad. They blend traffic from search, browse, and third-party sources into one number. Each of those traffic sources converts at wildly different rates. A blended benchmark is like averaging the speed of a bicycle and a sports car. Technically correct, practically useless.
In plain terms: filter your Play Console data by traffic source and country before comparing to benchmarks. The default view mixes everything together and makes your number look better (or worse) than it actually is.
Why the same app shows different conversion rates everywhere
You’d think “conversion rate” would mean the same thing everywhere. It doesn’t. Not even close.
Apple’s definition: (Downloads + Pre-Orders) / Unique Device Impressions. That’s from Apple’s own docs. Key word: unique. Each device counts once.
AppTweak’s definition: Uses total impressions (not unique). They also separate “conversion rate” (based on page views) from “install rate” (based on all impressions, including scroll-past). So AppTweak’s “conversion rate” and Apple’s “conversion rate” measure different things with different denominators.
Google Play’s definition: Store listing visitors who complete an install. Simpler, but still not the same base metric as Apple.
This matters in practice. UXCam reports the iOS App Store conversion rate as 33.7%. AppTweak says 25%. Same platform, same timeframe, 35% discrepancy. Neither is wrong. They’re just measuring different things.
And that 115.5% Navigation number from earlier? The denominator uses total page views. The numerator includes downloads from search results, where people never visited the page. Different bases, impossible-looking math.
Let’s make this concrete. Say your app got 1,000 downloads last month:
- App Store Connect might show 40% CVR (1,000 downloads / 2,500 unique impressions)
- AppTweak might show 25% CVR (1,000 downloads / 4,000 total impressions)
- Your analytics dashboard might show 18% (1,000 downloads / 5,500 total views including repeats)
Same app. Same month. Three different numbers. If you’re comparing your App Store Connect number to an AppTweak benchmark, you’re comparing apples to oranges. Understanding what CVR means in marketing is step one. Knowing how to calculate conversion rate properly (and which formula you’re using) is step two.
Our take: Before you freak out about being “below average,” check which definition you’re looking at. Half the anxiety around app store conversion rates comes from accidentally comparing different metrics.
Apple Search Ads vs organic conversion rates
This gap is massive. And it changes how you should read every benchmark number.
SplitMetrics’ 2025 Apple Ads benchmark report analyzed 3.1 billion keywords and 253 million downloads. The average conversion rate for Apple Search Ads was about 67%. For organic store browsing, it’s 25-27%.
That’s a 2.5x difference. Same app, same listing, same screenshots. The only difference is intent. Someone who searches “budget tracker” and sees your ad is already looking for a budget tracker. Someone browsing the Finance category might just be killing time.
The gap varies by category:
| Category | Apple Search Ads CVR |
|---|---|
| Sports | 73.0% |
| Travel | 72.6% |
| Shopping | 70.9% |
| Finance | 68.4% |
| Games | 54.2% |
If you run paid campaigns, your blended conversion rate (paid + organic combined) will look artificially high. That’s not your store listing being great. That’s your ad spend pulling up the average. Stop the ads, and your “conversion rate” drops overnight.
Google Play separates this more clearly. Play Console breaks traffic into three channels: search, explore, and third-party referrals. Each converts differently, and you can filter by each one. Useful.
AppsFlyer’s research adds another wrinkle. Running paid campaigns used to boost your organic downloads too (ads drive visibility, visibility drives organic installs). That effect has been declining for years. Organic’s share of total installs has dropped about 20% since 2016. You can’t count on ads to lift your organic numbers the way they used to.
This is similar to what we see in other paid channels. Facebook Ads conversion rates also vary wildly by campaign type and audience targeting. Blended numbers are almost always misleading, whether you’re looking at app installs or website conversions.
What actually moves your store listing conversion rate
Most people think improving app store conversion is some dark art. It’s not. The research is pretty clear on what moves the needle, and in what order.
Icon. SplitMetrics found icon changes can improve conversion by up to 30%. AppTweak’s 2025 benchmarks show +22.8% on the App Store and +20.2% on Google Play.
Apple’s own case study on Peak Brain Training showed an icon A/B test delivering +8% CVR at over 98% confidence. Your icon is the first thing people see. It matters more than most of the copy on your listing.
Screenshots. +21.7% on the App Store, +24.3% on Google Play. The first two screenshots do most of the work, since many people never scroll past them. Top apps update their screenshots 2-4 times per year. Top Google Play games update theirs up to 8 times.
Preview video. About +20% lift according to StoreMaven. But only about 6% of Google Play visitors actually tap to play a video. On iOS, autoplay in search results drove a +47% lift. The difference? People didn’t have to choose to watch it. If your video doesn’t autoplay, most people won’t see it.
Ratings. AppTweak’s 2025 data shows apps that improved from 3.6 to 4.2 stars saw roughly 60% higher conversion. And 90% of featured apps are rated 4.0 or above. If you’re below 4.0, that’s probably hurting you more than a mediocre screenshot.
Custom Product Pages. Think of these as different landing pages for your app listing. You create versions tailored to different audiences or ad campaigns. Apple calls them CPPs. They boost conversion by +5.9% for apps and +8.6% for generic keyword campaigns. Only 31% of apps use them. Free improvement sitting on the table.
A/B testing your store listing follows the same logic as testing your website. You change one thing, measure the result, and keep what works. Many apps drive a chunk of their installs from a website first. If you’re testing the web pages that send people to your app store listing, Kirro makes that part easy. Same principle, different page.
Free to paid app conversion rate
This is where app store conversion meets business conversion. Getting downloads is one thing. Getting people to actually pay is another.
Adapty’s 2026 subscription report (covering 16,000+ apps and $3B+ in revenue) breaks it down:
- Install to free trial: 10.9% globally
- Trial to paid: 25.6% globally
- Hard paywall install-to-paid: 12.11% median
- Freemium install-to-paid: 2.18% median
That’s a 5.5x difference between hard paywalls and freemium. RevenueCat’s 2025 report (115,000+ apps) confirms it: hard paywall at 10.7% vs freemium at 2.1%.
A hard paywall means the app requires payment before you can use it. No free version, no “try before you buy.” Freemium means you download for free and can upgrade later for extra features.
This feels counterintuitive. Shouldn’t giving people a free taste convert more of them? Not according to the data. Hard paywalls self-select for high-intent people. If someone pays upfront, they’ve already decided they want what you’re offering. Freemium casts a wider net but catches mostly people who never intended to pay.
There’s another surprise in the data: 80-90% of trial starts happen on Day 0 (RevenueCat). The moment someone downloads your app is the best shot you’ll get at conversion. If your onboarding doesn’t show value in that first session, you’ve probably lost them.
Weekly plans also convert 1.7-7.4x better than annual plans (Adapty). Lower commitment, easier yes.
For a deeper look at the trial-to-paid funnel specifically, see our free trial conversion rate benchmarks. And if you’re comparing these numbers to your SaaS product (not just your app), SaaS conversion rate benchmarks paint a similar picture from the web side.
How to measure your own app store conversion rate
Apple App Store Connect:
- Log into App Store Connect
- Go to Analytics → Conversion Rate
- You’ll see your CVR (downloads / unique impressions) over time
The important step: filter by traffic source. Your organic CVR and your paid CVR are completely different numbers (as we covered above). Looking at the blended number tells you almost nothing useful.
Apple also offers Peer Group Benchmarks, which compare your app’s performance to similar apps. It’s not perfect (the peer group can be broad), but it’s a free sanity check.
Google Play Console:
- Open Play Console
- Go to Grow users → Store performance → Conversion analysis
- You can filter by traffic channel (search, explore, third-party), country, and UTM tags
Google gives you 25th, median, and 75th percentile peer comparisons. Way more granular than Apple’s version. Use it.
A/B testing your listing:
Apple calls it Product Page Optimization (PPO). It’s one of several mobile app A/B testing approaches. You can test up to 3 versions of your store listing for up to 90 days.
Apple requires 90%+ confidence before declaring a winner. That’s the math saying “we’re pretty sure this isn’t random luck.” The Peak Brain Training icon test (+8% CVR) came from this exact feature.
Google calls it Store Listing Experiments. You can test graphics and text, and Google also shows you the impact on 1-day retention (not just installs). Handy for making sure your winning version doesn’t attract people who immediately uninstall.
The same testing mindset applies to the web pages that drive traffic to your store listing. If you’ve got a landing page that sends people to your app, test it with Kirro before worrying about the store listing. No point perfecting your app store page if the website sending people there is turning them away. Kirro’s visual editor lets you change a headline and run a test in about 3 minutes.
Knowing which conversion rate metrics to track (and which to ignore) matters here. Don’t measure everything. Measure the right things.
FAQ
What is a good conversion rate on the App Store?
About 25% is the overall average (AppTweak H1 2024). But “good” means above your specific category’s median. Finance apps average 52.3%, while Board Games sit at 1.2%. Comparing your game to the overall average is misleading. Also check your traffic source. Paid search converts at ~67% vs organic at ~25%, so a blended number hides what’s really happening.
Is a 2.5% conversion rate good?
It depends entirely on what you’re measuring. For your store listing conversion (page view to download), 2.5% is very low. That would put you well below even the worst-performing categories. But for install-to-paid conversion (the share of free downloaders who become paying customers), 2.5% is close to the freemium median of 2.18%. Different metrics, different benchmarks. Know which one you’re looking at.
How much can a 1,000 downloads app make?
It depends on your pricing model. At the freemium median of 2.18% install-to-paid, 1,000 downloads gives you about 22 paying customers. With a hard paywall (where people pay before using the app), the median is 12.11%, so you’d need fewer downloads to hit the same revenue. Multiply your paying customers by your price or average revenue per subscriber to get the actual number. Sensor Tower’s 2025 report shows global in-app purchase revenue hit $150B, with download growth flat but revenue still climbing. Revenue per install matters more than raw download counts.
Apple App Store vs Google Play: which converts better?
Google Play has a slightly higher store listing conversion rate (27.3% vs 25%). But iOS generates about 5.6x more subscription revenue per install. Higher store conversion doesn’t mean higher revenue. If you’re choosing where to focus, the conversion rate comparison alone won’t tell you much. Think about your monetization model, your target audience’s platform preferences, and which store gives you better tools to measure and test (Google Play’s analytics are more granular for free).
How do I improve my app store conversion rate?
Start with your icon. It has the biggest impact, with up to +30% conversion improvement in testing. Then work on your first two screenshots (+22% potential). Check your ratings next. Apps below 4.0 stars are rarely featured by either store. If you’re running ads, set up Custom Product Pages (Apple) or Store Listing Experiments (Google) so your listing matches the ad that brought people there. For a full strategy guide, see our app conversion rate optimization post. And if your app gets installs from a website, test that landing page too. The store listing isn’t the only page that matters.

Randy Wattilete
CRO expert and founder with nearly a decade running conversion experiments for companies from early-stage startups to global brands. Built programs for Nestlé, felyx, and Storytel. Founder of Kirro (A/B testing).
View all author posts