Facebook Ads conversion rate benchmarks at a glance
Most articles about Facebook Ads conversion rate give you one number and call it a day. That number is usually 9.21%. It’s from 2017. It measured lead forms, not purchases. And it used a tracking system that no longer exists. Good conversion rate optimization starts with better benchmarks.
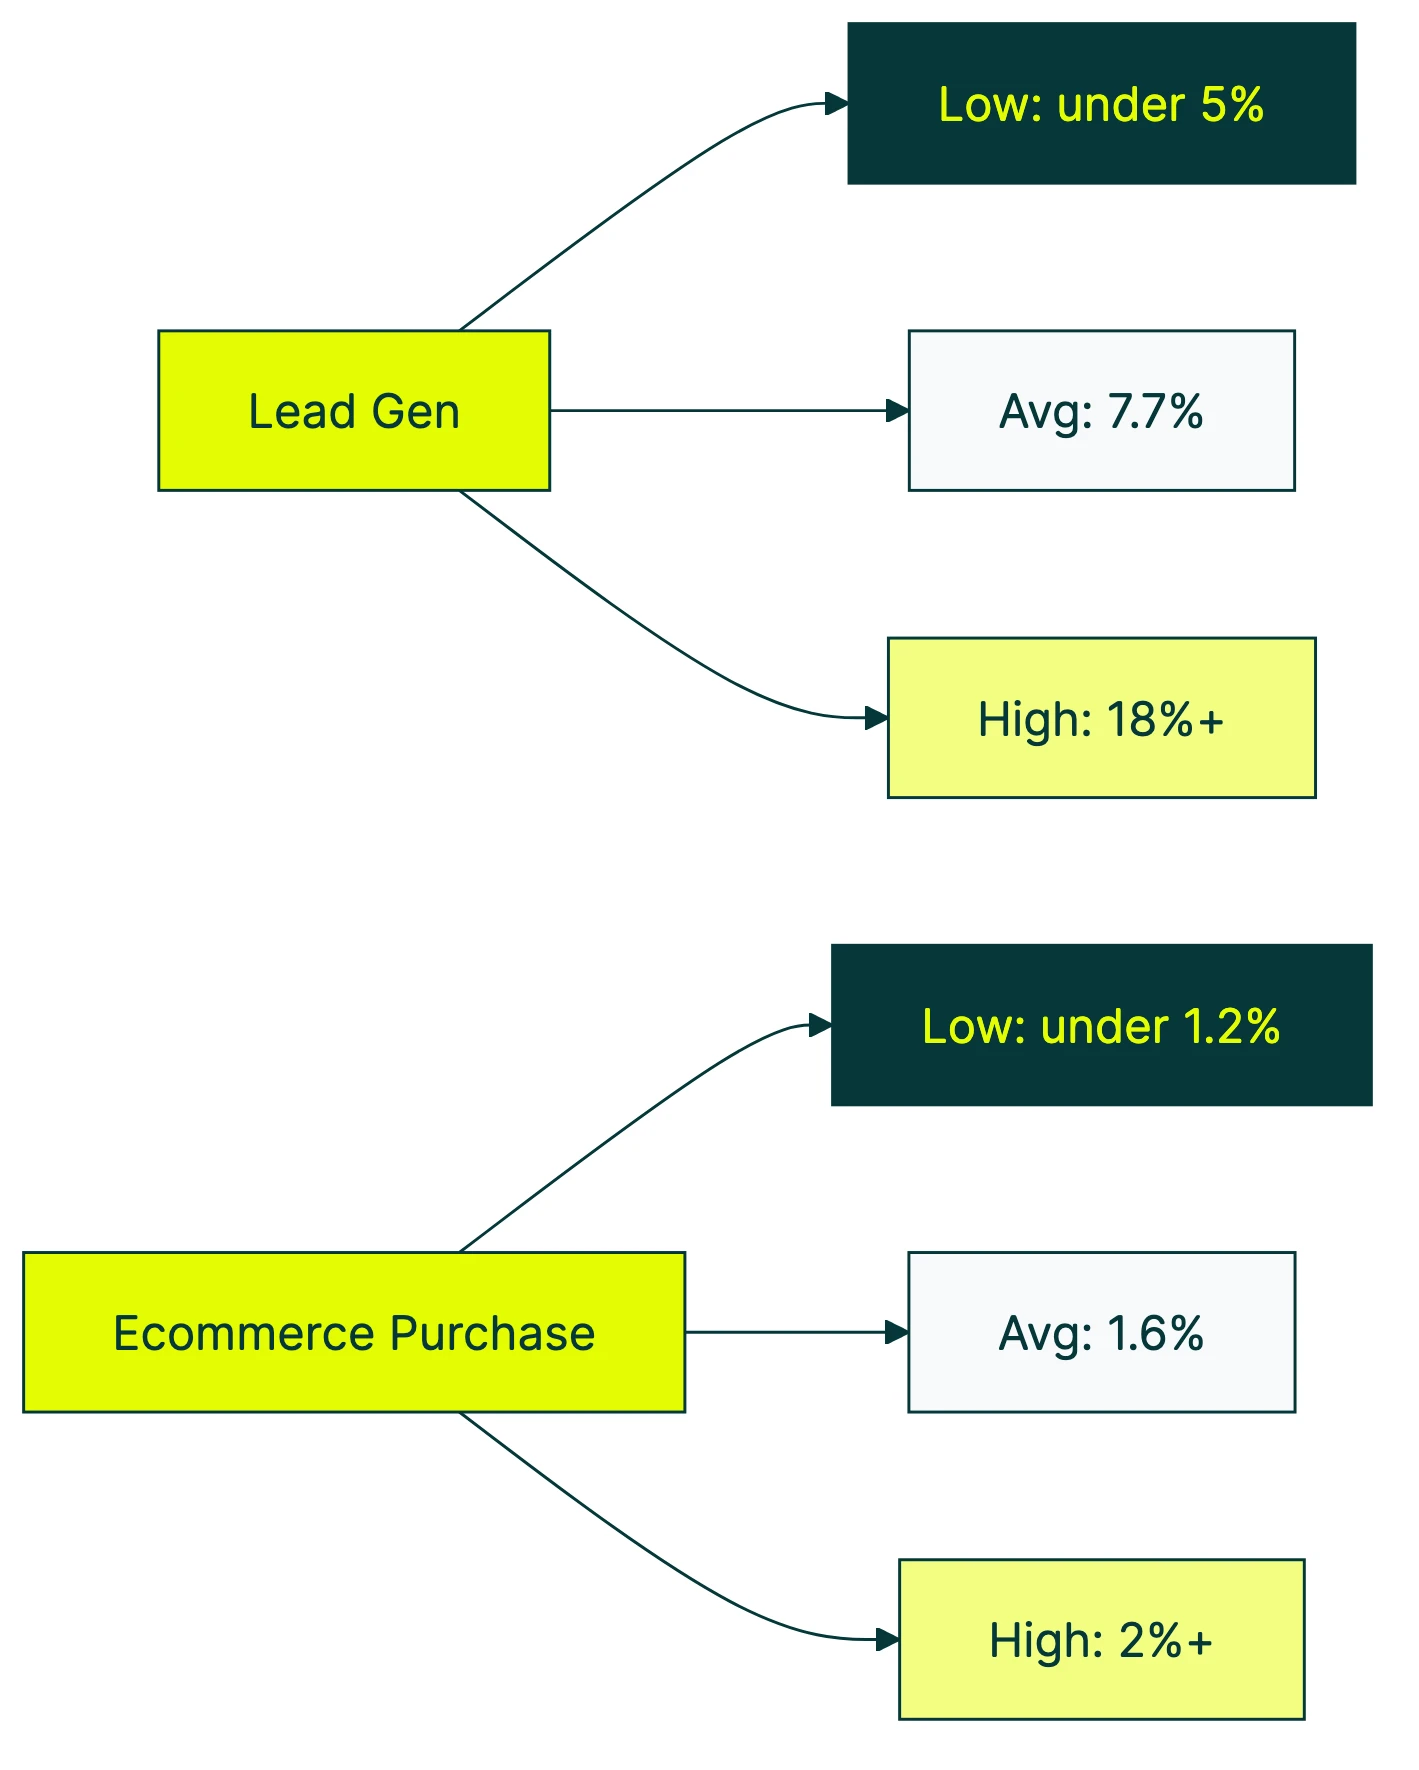
Here’s what the data actually says in 2025. WordStream’s benchmark study (726+ campaigns) puts the average lead gen conversion rate at 7.72%. Triple Whale’s study (35,000 ecommerce brands) puts the median purchase conversion rate at 1.6%.
Those aren’t the same metric. Comparing them is like comparing your marathon time to your 100-meter dash. Both involve running. Both measure speed. But they’re not the same race.
If you’re wondering where your numbers fit in the bigger picture, see what counts as a good conversion rate across all channels and industries. And if CVR keeps popping up in your dashboards, that just means “conversion rate” in shorthand.
What is Facebook ad conversion rate (and why there are actually two of them)
At its simplest, Facebook Ads conversion rate is the percentage of people who clicked your ad and then did the thing you wanted. Filled out a form. Bought a product. Signed up for a trial. You can calculate it the same way you’d calculate any conversion rate: conversions divided by clicks, times 100.
Simple enough. Except Meta’s Ads Manager makes it confusing in two ways.
First, it counts conversions that happened within a time window after someone interacted with your ad. Not just right after they clicked. Someone clicks your ad on Monday, browses your site, leaves, comes back through Google on Thursday, and buys. Meta counts that as a Facebook conversion. Google Analytics counts it as a Google one. Same sale, two platforms taking credit.
Second (and this is the part nobody mentions), Meta counts something called view-through conversions by default. That means someone saw your ad, didn’t click it, but later converted. Jon Loomer’s analysis found this inflates the numbers you see in Ads Manager compared to what your landing page actually achieved.
So when WordStream says the average is 7.72%, they’re measuring lead form fills from accounts running the “conversions” objective. When Triple Whale says the median is 1.6%, they’re measuring actual purchases. The first number is always going to be higher because getting someone to fill in their email is easier than getting them to pull out their credit card.
Our take: Every time you see a “Facebook Ads conversion rate” benchmark, your first question should be “conversion to what?” If the article doesn’t answer that, the number is useless. And most articles don’t answer it.
That distinction between click conversion rate (what happened per click) and conversion rate as a broader metric matters here more than almost anywhere else in paid media. For Facebook Ads CTR benchmarks and how they compare to other platforms, we break that down separately.
Average Facebook Ads conversion rate by industry (2025 data)
Here are two tables. Not one. Two. Because lead generation and ecommerce purchases are different metrics, and mixing them together helps nobody.
Lead generation conversion rates by industry
This data comes from WordStream’s 2025 Facebook Ads benchmarks, covering 726+ campaigns running the conversions objective. “Conversion” here means a lead form fill, phone call, or other lead-gen action.
| Industry | Average CVR (2025) | Change from 2024 |
|---|---|---|
| Restaurants & Food | 18.25% | +5.77% |
| Attorneys & Legal | 10.53% | -1.73% |
| Education | 10.08% | -3.66% |
| Auto | 8.77% | +1.03% |
| Beauty & Personal Care | 8.40% | -2.91% |
| Health & Fitness | 8.03% | -2.19% |
| Real Estate | 7.81% | -1.02% |
| Overall Average | 7.72% | -1.06% |
| Finance & Insurance | 7.19% | +0.77% |
| Industrial & Commercial | 6.83% | -0.90% |
| Home Improvement | 5.22% | -1.32% |
| Physicians & Surgeons | 4.51% | -6.37% |
| Furniture | 3.77% | -0.80% |
Notice the trend. 12 of 15 industries saw their conversion rates drop from 2024 to 2025. The overall average fell from 8.78% to 7.72%. And while rates dropped, the cost per lead went up 21% ($21.98 to $27.66). More expensive, fewer conversions. Fun.
Ecommerce purchase conversion rates by industry
This data comes from Triple Whale’s 2025 benchmarks, covering 35,000 ecommerce brands. “Conversion” here means an actual purchase.
| Industry | Median purchase CVR |
|---|---|
| Food & Beverage | 2.02% |
| Beauty | 1.94% |
| Pets & Animals | 1.80% |
| Health & Wellness | 1.65% |
| Overall Median | 1.6% |
| Home & Garden | 1.42% |
| Sports & Outdoors | 1.28% |
| Electronics | 1.20% |
These numbers look tiny compared to the lead gen table. That’s normal. Getting someone to spend money is harder than getting them to share their email. If you’re running ecommerce ads and your purchase conversion rate is above 2%, you’re doing better than most.
For comparison, SaaS conversion rate benchmarks show a similar pattern. Free trial signups convert at much higher rates than paid purchases.
Why the old 9.21% benchmark is misleading
If you’ve researched Facebook Ads conversion rates before, you’ve seen 9.21%. It shows up everywhere. Blog posts cite it like gospel. The problem? It’s nearly a decade old.
That number comes from WordStream’s original 2017 study. Here’s what the study actually measured: 256 advertiser accounts. Data from November 2016 to January 2017. Only campaigns running the “conversions” objective. And a 28-day attribution window, meaning Meta counted a conversion if someone bought within 28 days of clicking. Back then, Meta could track people across websites freely. None of that is true anymore.
The attribution window is now 7 days by default, not 28. Apple’s privacy changes (more on that in a second) broke most cross-site tracking. Meta introduced something called “modeled conversions” (basically educated guesses about conversions it can’t directly measure). And WordStream’s own updated data contradicts the old number. Their 2024 study showed 8.78%. Their 2025 study shows 7.72%. The trend is going down, not holding at 9.21%.
So why does everyone still cite it? Because it’s a higher number, and higher numbers get more clicks. And because most articles about Facebook Ads benchmarks just copy from each other without checking the source date. That’s the whole reason.
Our take: If someone quotes 9.21% as the average Facebook Ads conversion rate in 2026, they’re either lazy or they haven’t checked their sources since the first season of Stranger Things. The real average for lead gen is closer to 7.72%, and for ecommerce purchases it’s 1.6%.
How iOS 14.5 changed everything about Facebook conversion tracking
In April 2021, Apple released iOS 14.5 with something called ATT (App Tracking Transparency). In plain language: your iPhone started asking “Do you want this app to track you across other apps and websites?” And most people said no.
The numbers tell the story. About 50% of people globally opt in to tracking, and only 44% in the US. That means Meta lost visibility into roughly half of what iOS users do after clicking an ad.
This broke Facebook’s conversion tracking in several ways.
The attribution window (how long after a click Meta credits a conversion) shrank from 28 days to 7 days. Meta used to be able to see what you did across the entire internet for nearly a month. Now it gets a one-week peek. Meta admitted their iOS web conversion reporting was underreporting by 8-15%. And agency Elumynt found that 50-81% of actual revenue was missing from Meta’s dashboard for some advertisers.
To fill the gap, Meta introduced “modeled conversions.” Think of it like this: Meta can see that 100 people clicked your ad. It can confirm that 10 of them converted. But it knows 50 of the clickers have tracking blocked. So it estimates that probably 5 of those 50 also converted, and adds those 5 to your dashboard. Those estimated conversions are real line items in your Ads Manager. You can’t tell which ones are measured and which ones are guesses.
This matters because every benchmark you look at (including the WordStream and Triple Whale numbers above) includes modeled conversions. The numbers are probably in the right ballpark, but they’re not exact. If you’re interested in how tracking challenges affect other platforms, we cover cookieless A/B testing approaches for a privacy-first world.
Conversion rates by campaign objective and audience type
Industry benchmarks are helpful, but the type of campaign you’re running changes the number even more.
By campaign objective
Not every Facebook campaign is designed to convert. This sounds obvious, but people regularly compare their traffic campaign’s conversion rate to a lead gen benchmark and panic.
- Lead generation campaigns: ~7.72% average (WordStream 2025). This is the number most benchmarks cite.
- Ecommerce/purchase campaigns: ~1.6% median (Triple Whale 2025). Different goal, different math.
- Traffic campaigns: No meaningful CVR benchmark exists. They’re built to drive clicks, not conversions. Judging them on conversion rate is like grading a fish on its tree-climbing skills.
- App install campaigns: Completely separate metric. See mobile app conversion rate benchmarks for those.
When you set a goal conversion rate, match it to your actual campaign objective. A 3% purchase rate doesn’t mean the same thing as a 3% lead rate.
By audience type
Who you’re targeting matters enormously. Focus Digital’s data shows retargeting audiences converting at roughly 15.8%, while cold prospecting audiences sit around 4.3%.
Those retargeting numbers are inflated, though (we’ll explain why in the measurement section below). And broad targeting (letting Meta’s algorithm find your audience instead of you picking one) delivers 49% higher return on ad spend than lookalike audiences post-iOS 14. That’s from Lebesgue’s analysis of $3B+ in ad spend. Meta’s AI targeting got better as manual tracking got worse.
Meta’s Advantage+ Shopping Campaigns (their AI-powered campaign type) now eat up 34% of retail Meta ad budgets. That’s Q4 2024, per Tinuiti’s benchmark report. But Measured.com’s incrementality tests across 30+ brands told a different story. The median brand actually underperformed compared to traditional campaigns. The self-reported numbers looked great. The actual results? Not always.
How to actually improve your Facebook Ads conversion rate
Most advice about improving Facebook Ads conversion rates focuses on the ad itself. Better creative, better copy, better targeting. That matters. But there’s an entire half of the equation nobody talks about: what happens after someone clicks.
Fix the landing page first
You can’t control Meta’s algorithm. You can’t control who sees your ad (not really, not anymore). But you control what happens after the click. That’s your landing page.
Make sure your landing page says the same thing your ad promised. If your ad says “50% off running shoes” and your landing page says “Welcome to our store,” you’ve already lost them. This is called message match, and it’s the easiest win in paid media.
Most Facebook traffic comes from mobile. If your landing page looks weird on a phone, your conversion rate will suffer. Load speed matters too. Every extra second of load time kills conversions. This isn’t abstract. It’s money leaving your pocket.
For practical advice on improving pages, check out our guide to landing page optimization.
Set up Conversions API (CAPI)
The Meta Pixel (a small piece of code on your website that tracks visitors) isn’t enough anymore. Too many people have tracking blocked. CAPI is a second tracking system that sends conversion data directly from your server to Meta, bypassing the browser restrictions that iOS created.
Brainlabs found CAPI delivered a 13% cost-per-result improvement and 19% more attributed conversions. Pearmill reported 10-25% attribution improvement from CAPI implementation.
Those aren’t magic. CAPI doesn’t create conversions out of thin air. It just helps Meta see conversions that were already happening but couldn’t be tracked through the browser.
Test your landing page, not just your ads
Most advertisers miss this completely. They’ll spend hours A/B testing ad creative in Ads Manager. Different images, different headlines, different copy. Then they send all that traffic to one landing page they’ve never tested.
That’s like perfecting your pickup line and then taking every date to the same terrible restaurant.
A/B testing your landing page (trying different headlines, buttons, or layouts to see which gets more conversions) is where the real gains hide. You can test this on your own site in about three minutes with Kirro. Change a headline, split the traffic, see which version gets more people to buy or sign up.
For more on how testing and ads work together, see our guide to Meta A/B testing and A/B testing your conversion rate.
Use broad targeting
This feels counterintuitive, but post-iOS 14, letting Meta’s algorithm find your audience often beats hand-picking your targeting. The data backs it up: broad targeting delivers 49% higher return on ad spend than lookalike audiences, according to analysis of billions in spend.
Meta’s machine learning got better at finding buyers even as its tracking got worse. If you’re still manually setting detailed interest targeting, test broad against it. You might be surprised.
The measurement problem nobody talks about
Everything we’ve discussed so far assumes the numbers in your Ads Manager are accurate. They’re not. At least, not in the way you’d expect.
Measured.com ran incrementality tests (tests that measure whether an ad actually caused a sale, or if the sale would have happened anyway). Here’s what they found:
- Broad prospecting campaigns: Meta underreported the actual incremental impact by 180%. Meaning these campaigns were working almost three times better than Meta’s dashboard showed.
- Retargeting campaigns: Meta overclaimed credit for sales that would have happened without the ad.
In plain language: if you’re running retargeting campaigns and seeing amazing conversion rates, some of those “conversions” probably would have happened without the ad. The person was already going to buy. Meta just happened to show them an ad first and took the credit.
And if you’re running cold prospecting campaigns and the numbers look disappointing, the real impact might be much larger than what your dashboard shows.
What to do about it
Don’t rely solely on Meta’s numbers. Cross-reference with your own data.
Check your ecommerce conversion rate in Google Analytics or your CRM. Compare what Meta says it drove versus what your own systems recorded. GA4 uses last-click attribution by default. That means it gives credit to the last thing someone clicked before converting. Meta uses 7-day click / 1-day view. These will always show different numbers. That’s normal. But if Meta says it drove 200 sales and your Shopify shows 95, the gap is telling you something.
Once you know your real conversion rate (not just what Meta reports), you can set up a free test on your landing page and improve it with confidence. Kirro tracks which version of your page converts better, so you’re working with your own data instead of Meta’s estimates. For more on how GA4 tracks conversion rate, we’ve got a separate breakdown.
How to track conversions from split testing your landing page
If you’re running Facebook Ads to a landing page you’re also A/B testing, keep your attribution clean. Make sure your A/B testing tool doesn’t interfere with Meta’s Pixel or CAPI. You want both systems tracking the same visitors without double-counting.
FAQ
What is a good Facebook Ads conversion rate?
It depends entirely on what you’re measuring. For lead generation (form fills, signups), above 8% is good and above 10% is excellent. The overall average is 7.72% per WordStream’s 2025 data. For ecommerce purchases, above 2% is good. The median is 1.6% per Triple Whale. Comparing your lead gen rate to a purchase benchmark (or vice versa) will either make you feel terrible or falsely confident. Match the benchmark to your conversion type.
How do you track Facebook conversions after iOS 14?
Use Meta Pixel plus Conversions API together. The Pixel (a piece of code on your website) catches what it can through the browser. CAPI sends conversion data directly from your server, bypassing browser restrictions. Together they recover most of the tracking that iOS 14.5 broke. Brainlabs reported 19% more attributed conversions with CAPI added. Without CAPI, you’re flying partially blind.
Why is my Facebook conversion rate different in Ads Manager vs Google Analytics?
Different attribution models. Meta uses 7-day click / 1-day view (if someone clicked within 7 days or saw the ad within 1 day, Meta claims the conversion). GA4 defaults to last-click (whoever got the last click before the conversion gets all the credit). Meta also counts view-through conversions (someone saw your ad but didn’t click, then converted later). GA4 doesn’t count those. Neither is “wrong.” They’re measuring different things.
Is a 2.5% conversion rate good for Facebook Ads?
For ecommerce purchases, yes. The median is 1.6%, so 2.5% puts you well above average. For lead generation, no. The average is 7.72%, so 2.5% means something in your funnel needs work. Context is everything. A 2.5% click conversion rate on high-ticket items might generate more revenue than a 10% rate on a free ebook download.
Has the average Facebook Ads conversion rate gone up or down?
Down. WordStream’s data shows lead gen conversion rates dropped from 8.78% in 2024 to 7.72% in 2025. Twelve of fifteen industries declined. Meanwhile, cost per lead rose 21% ($21.98 to $27.66). More competition, more privacy restrictions, higher costs. The days of cheap, highly-trackable Facebook conversions aren’t coming back. Focus on what you can control: making your landing page convert better with the traffic you’ve got.

Randy Wattilete
CRO expert and founder with nearly a decade running conversion experiments for companies from early-stage startups to global brands. Built programs for Nestlé, felyx, and Storytel. Founder of Kirro (A/B testing).
View all author posts