Landing page split testing means showing two versions of a page to different visitors, then keeping the version that converts better. Half your traffic sees the original. The other half sees the new version. The numbers pick the winner. (First, make sure you understand the difference between a landing page and a website . The testing approach changes depending on which you’re working with.)
Sounds simple. It is simple. But most guides skip the parts that actually matter. Which page should you test first? How much traffic do you need? How long do you wait? And what do you do when the results are… nothing?
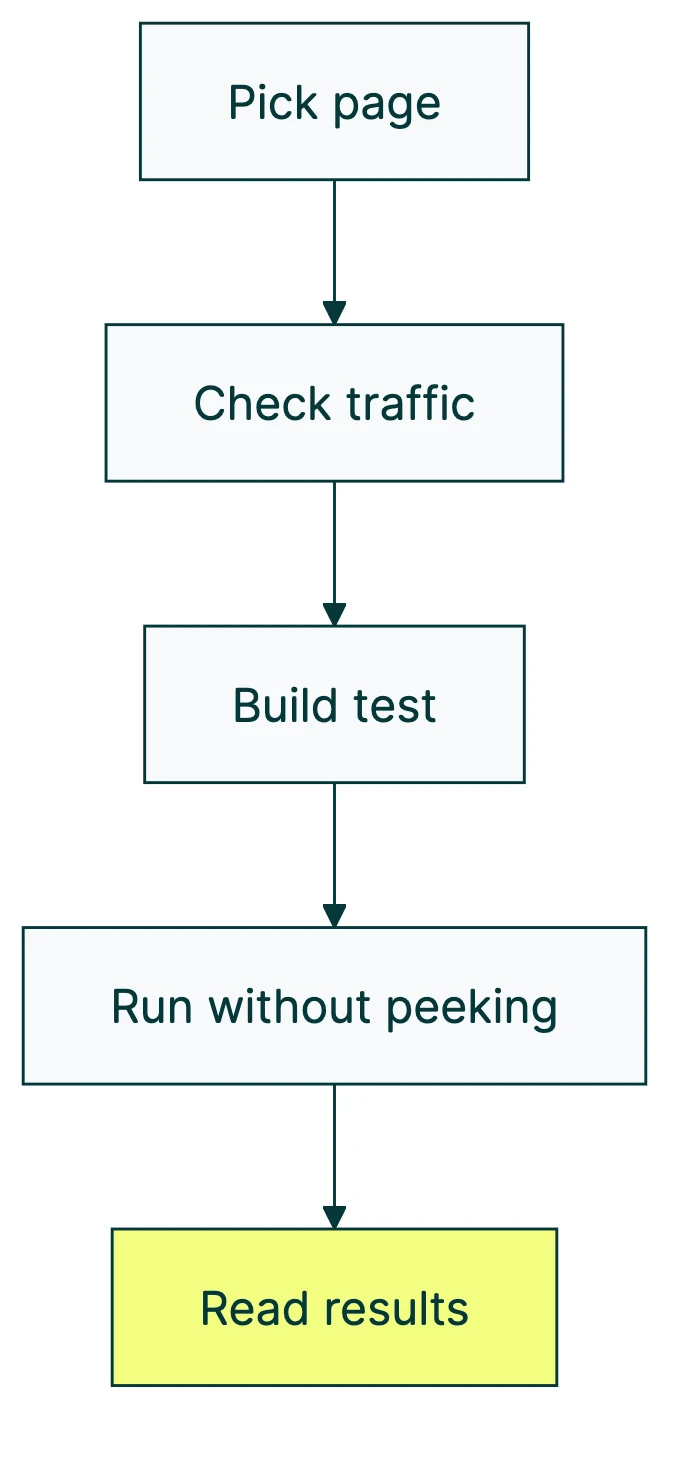
This is the full playbook. Five steps, real data, and a few uncomfortable truths about what split testing actually means when you do it on landing pages. Before you start testing, make sure your page follows the core landing page best practices. Then audit it with the landing page checklist to find the biggest opportunities. And use the sample size calculator to figure out how many visitors you need. Getting the testing methodology right matters more than running more tests. (Need the foundations first? Our complete A/B testing guide is a good place to start.)
What landing page split testing actually is (and isn’t)
You have a landing page. Maybe it sells a product, collects emails, or books demos. You think it could do better. So you create a second version with one thing changed (a headline, a button, a hero image) and send half your visitors to each version.
The version that gets more people to do the thing you want? That’s your winner.
There are two flavors. The first changes elements on the same page using a bit of code that swaps things out behind the scenes. This is what most split testing tools do. The second sends visitors to a completely different URL. Same idea, different mechanics. If you’re unsure which approach you’re looking at, our guide on how A/B testing and split testing differ clears it up.
The URL version is more work but gives you more freedom. You can redesign the entire page, not just tweak a button. The trade-off? You need to think about SEO (more on that in Step 4).
Our take: Start with on-page testing. It’s faster, easier to manage, and search engines won’t get confused. Save URL split tests for when you want to test radically different designs.
Why most landing page testing guides get it wrong
Every guide tells you the same thing. Test your headline. Test your CTA. Test your hero image. And sure, that’s fine advice. But it’s like saying “to cook well, use good ingredients.” True. Useless without a recipe.
What nobody mentions when they talk about conversion rate optimization: only 36% of A/B tests produce a clear winner. That’s from the DRIP Agency database, which tracked 91 European e-commerce brands running real tests.
At Google and Bing, 80-90% of their tests show no positive effect. Researcher Ron Kohavi documented this across thousands of experiments. He’s probably run more tests than anyone alive.
Most tests are inconclusive. That’s normal, not failure.
And “best practices” can actually make things worse. WineExpress followed the standard playbook: bigger buttons, urgency timers, all the usual tricks. Conversions dropped. Chris Goward at WiderFunnel documented it. Context matters more than rules.
So how do you actually split test landing pages the right way? Five steps. Start here.
Step 1: pick the right page to test first
Not all landing pages deserve your attention equally. If you’ve got five landing pages and limited traffic, picking the wrong one to test first wastes weeks.
The formula is simple. Page value = monthly traffic × conversion gap. The conversion gap is the difference between your current rate and where you should be based on industry benchmarks.
Where should you be? The Unbounce 2024 benchmark report analyzed 464 million visitors across 41,000 landing pages. The overall median conversion rate was 6.6%. SaaS pages averaged around 3.8%. For a full breakdown of landing page conversion rate by industry, we cover the benchmarks separately.
One interesting finding: pages written at a 5th-to-7th grade reading level converted 56% better than pages written at an 8th-to-9th grade level.
Simpler words, more conversions. Not a bad lesson for the page you’re about to test.
Picking which test to run first
Once you know which page to focus on, you need to decide what to test. Three frameworks help you prioritize ideas:
| Framework | How it works | Best for |
|---|---|---|
| ICE (Sean Ellis) | Score each idea on Impact, Confidence, and Ease (1-10 each). Multiply. Highest score wins. | Quick gut-check prioritization |
| PIE (Chris Goward) | Score on Potential, Importance, and Ease. Similar to ICE but weights page importance. | When some pages matter way more than others |
| PXL (CXL) | Binary yes/no questions instead of subjective scores. “Is this above the fold?” “Based on user data?” | Teams that argue too much about scores |
Pick one. Any of them beats “let’s just test the button color.” The point is having a system so you test what matters, not what’s easiest. If you’re not sure where to focus, understanding what makes a high converting landing page can help you identify the elements worth testing first.
DRIP Agency’s data shows which test types win most often. Popup tests had a 72% win rate. Contact info layout changes won 63% of the time. Scarcity and urgency elements won 48% of the time, but when they won, they won big (84% decisive victory rate).
Step 2: check your traffic (the math most people skip)
Nobody puts this on the marketing blog. Detecting a 5% improvement requires around 200,000 visitors, according to Kohavi’s research at Microsoft. Most small business landing pages don’t get that in a year. The number depends on your MDE threshold — the smallest improvement worth detecting.
Don’t panic. You probably don’t need to detect a 5% improvement. You need to detect a big improvement, and that takes way less traffic.
Practical thresholds for landing page split testing:
- 1,000+ visitors per week to the specific page: you can test
- Under 1,000 per week: test bigger changes, or try alternatives
- 50+ conversions per week: minimum for trustworthy results
Convert.com’s research confirms this. 37% of tests use between 10,000 and 50,000 total visitors. Only 9% reach 100,000 or more. You don’t need millions. Just enough to tell signal from noise.
And timing matters. The median test duration in DRIP Agency’s database was 42 days. Not the 2 weeks most guides suggest. That’s almost 6 weeks of patience.
Not sure if you have enough traffic? Try running a power analysis first, or use an A/B test sample size formula for exact numbers for your situation.
What to do when your traffic is too low
Low traffic doesn’t mean you can’t test. It means you test differently.
- Test bigger changes. Forget button colors. Test entirely different page designs, headlines, or offers. Bigger differences need less traffic to detect.
- Use math that works with less traffic (experts call this Bayesian statistics). It gives you answers faster because it uses what you already know instead of starting from scratch. More on this in Step 5.
- Test smaller goals first. Instead of waiting for purchases, track clicks, scroll depth, or form starts. These happen more often and give you signal faster.
If your landing page gets under 500 visitors a month, split testing landing pages probably isn’t the right move yet. Focus on getting more traffic first through landing page optimization fundamentals, then come back when you have the numbers.
Step 3: build your test (what to change and why)
“Test the headline” is advice that’s both correct and incomplete. The question is: what should the new headline say? And why would it work better?
This is where testing goes from guessing to a real method. You need what’s called a test idea (the industry term is “hypothesis,” but that sounds like a science fair). It looks like this: “If I change [thing] to [new thing], more people will [do the thing] because [reason].” Our full guide on how to design a marketing experiment walks through this process in detail.
The reason matters. Without it, you’re just randomly swapping elements and hoping something sticks.
Research first, test second
Peep Laja, who founded CXL and has 12 years of testing under his belt, had only 6 test failures in 5.5 years. His secret? He researches before he tests. He looks at three things:
- Run your page through a landing page analyzer. It gives you a structured starting point before you test anything.
- Walk through the page yourself. Where do you get confused? Where does it feel slow? What would make you leave?
- Look at your numbers. Where do people drop off? Which sections get ignored? (Your analytics tool shows this.)
- Ask real people. Watch someone use the page. Even 5 people will reveal problems you never noticed.
What to test (ordered by impact)
Not all changes are equal. The data points to a clear hierarchy.
The biggest lever? Form length. This is especially true for lead generation landing page elements like form fields and CTA buttons. Average improvement: 120% lift. Baymard Institute found the average checkout uses 11.3 form fields but only needs 8. Cutting from 11 fields to 4 has shown 160% more conversions in some tests. If your landing page has a long form, start there.
Headlines swing between 27% and 104% lift. The travel company Going changed their button text (just the text!) and saw 104% more premium trial signups. One line of copy.
Then there’s personalization. Buttons that change based on who’s visiting convert 202% better than generic ones. And images matter more than most people think: moving images boost conversions by about 80%, and video testimonials outperform text by the same margin.
One pattern across all the research: simpler pages win. Pages with fewer than 10 elements convert at double the rate of pages with 40+ elements. Starting with a high converting template as your test baseline gives you a clean structure to test against, rather than trying to fix a cluttered page one element at a time.
One rule above all: change one thing at a time. Our split testing best practices guide covers this and eight other rules backed by real data. Swap the headline and the button and the image at once, and you’ll never know which one mattered. It’s like changing three ingredients in a recipe at the same time. The dish might taste better, but you won’t know why.
Want to test multiple things at once? That’s a different approach called testing multiple variables at once. It needs way more traffic.
Most A/B testing tools can handle this. Kirro lets you set up a test without writing code. Pick a page, change the headline in the visual editor, and hit start. Three minutes, roughly. If your landing pages run on Webflow, our guide to testing on Webflow covers the platform-specific setup. Running paid search? Our guide to Google Ads landing page testing covers how to pair ad experiments with page tests. Most people spend longer choosing a Netflix show. If privacy is a concern for your audience, our guide on privacy-compliant split testing covers how to set up tests that work without third-party cookies.
One more thing from the research: “Don’t miss out” beats “Get exclusive benefits” by about 22% in tests. People respond more to losing something than gaining something. And 75% of visitors look for reviews or testimonials before buying. If your landing page doesn’t have social proof, that’s probably your first test right there.
Step 4: run the test without ruining your results
You’ve picked a page, checked your traffic, and built a test with a clear reason behind it. Now the hard part: waiting.
How long to run your test
Set the duration before you launch. Minimum: 2 full business cycles (usually 2-4 weeks). DRIP Agency data says the median is 42 days for trustworthy results.
Why so long? Three reasons.
Weekday visitors behave differently from weekend visitors. If you only run Tuesday through Thursday, you’re getting a skewed picture. Like surveying people’s eating habits but only on Thanksgiving.
New designs get extra attention just for being new (this fades after about 2 weeks). A spike in the first week doesn’t mean your new version is better. It might just mean it’s shiny.
Seasonal weirdness ruins data. Don’t launch a test during Black Friday, a product launch, or any period where traffic isn’t normal.
The peeking problem (this is the big one)
When you check your test results repeatedly and stop the moment something looks good, your error rate shoots from 5% to 26%. That’s 5x higher. Evan Miller proved this mathematically and called the auto-stopping features in some testing platforms “a statistical abomination.”
Think of it this way. You flip a coin 10 times and get 7 heads. You might conclude the coin is rigged. But flip it 1,000 times and you’ll get close to 50/50. Stopping early is like declaring the coin rigged after 10 flips.
The fix is simple: decide how long you’ll run the test before you start, then don’t touch it until that date. Set a calendar reminder and walk away. Or use sequential testing methods that let you check results at planned intervals without inflating your error rate.
Our take: The peeking problem is the single biggest reason landing page tests give bad results. Every week, someone “wins” a test that was really just noise. If you only remember one thing from this guide, make it this: don’t peek.
Protecting your SEO during split tests
If you’re running URL split tests (sending visitors to different page addresses), Google has specific rules. Break them and your search rankings can suffer. Google Search Central lays them out:
- Add a canonical tag to test versions. This is a small piece of code that tells Google “this page is just a test version, the real one lives here.” It keeps Google from getting confused about which page to show in search results.
- Use temporary redirects (302), not permanent ones (301). Temporary tells Google “this is a test, things will go back to normal.” Permanent tells Google “the old page is gone forever.”
- Don’t show Google a different page than visitors see. That’s called cloaking, and Google penalizes it.
- Don’t run tests forever. Google may see two similar pages as an attempt to game the system if the test runs indefinitely.
Want to go deeper on this? Our guide on SEO and A/B testing covers the technical details. For SEO for landing pages specifically, we cover the full checklist and indexing decisions. And for broader guidance on making CRO-safe SEO changes, we break down which optimizations help both channels and which create conflicts.
Step 5: read your results (and what to do next)
Your test ran its full course. Time to read the numbers.
The industry standard is 95% confidence. That means there’s only a 5% chance the result happened by luck. Convert.com found that 70% of testing teams run to at least 95% confidence, and 49% push all the way to 99%.
Reality check: 60% of completed tests deliver less than 20% lift. The median improvement across real tests is just +2.77% in revenue per visitor (DRIP Agency). That’s not nothing. Over thousands of visitors, 2.77% adds up fast.
If someone tells you their headline test got a 200% lift, be skeptical. Only 7.8% of tests show 100%+ improvement. There’s an old rule in data analysis (called Twyman’s Law): if a number looks too good to be true, it probably is. Those dramatic results are usually bugs or false positives.
Two ways to measure results
The traditional way (called frequentist statistics) gives you a yes-or-no answer: “The result is significant” or “It’s not.” Clear, but rigid. Needs lots of data.
The newer way (called Bayesian statistics) gives you a probability: “Version B has an 89% chance of being better.” This works better with less traffic because it factors in what you already know, not just what the test measured. Kirro uses Bayesian stats so you see plain-language results instead of confusing technical numbers.
Either method works. Bayesian is friendlier for smaller sites. Frequentist is more common in big companies and academic research. For a deeper look, our guide to Bayesian A/B testing breaks it down. And if you want to understand the full range of CRO test types beyond split testing, that guide covers when each method is worth using.
After a winner
Implement it. Document what you changed and why it worked. Plan your next test. Testing is a cycle, not a one-time event. That 2.77% average lift compounds if you keep testing. Five winning tests at 2.77% each? That’s a meaningful difference in your revenue.
After no winner
That’s still useful information. It means the thing you tested doesn’t matter much to your visitors. Try something bigger next time. If your headline test was inconclusive, maybe the headline was already fine. Test the offer instead.
Watch for hidden patterns
Sometimes a test shows no overall winner, but Version B crushed it on mobile while Version A won on desktop. If you only looked at the combined number, you’d miss this entirely. Always check your results by device, by traffic source, and by new vs. returning visitors when you measure your A/B test conversion rate.
The 5 mistakes that waste your testing budget
After the step-by-step, here are the traps. If you’ve made some of these common A/B testing mistakes, join the club. Everyone has.
Mistake 1: testing without enough traffic. Go back to Step 2. If you don’t have 1,000 visitors per week to the specific page, you’re reading tea leaves, not data.
Mistake 2: stopping tests too early. The peeking problem inflates your error rate 5x. Set a deadline. Walk away. Come back when the calendar says so.
Mistake 3: testing tiny changes on low-traffic pages. Button color on a page that gets 500 visitors a month? You’ll wait 6 months for a result that probably means nothing. Test bigger. Or test a different page.
Mistake 4: ignoring the novelty effect. New designs get extra engagement for about 2 weeks just because they’re new. Facebook saw this when they switched from chronological to algorithmic feeds. (If you’re running Meta ad A/B tests, the novelty effect hits ad creative especially hard.) Engagement dropped at first, then recovered as people adjusted. The flip side (called the primacy effect): experienced visitors resist change at first, then adapt. Run tests for at least 4 weeks to let both effects settle.
Mistake 5: copying “winning” tests from other companies. Remember WineExpress? Standard best practices made their conversions worse. Andrew Anderson (14 years in testing, 300+ organizations) puts it bluntly: “Case studies are almost all frauds… just noise and empty marketing.” The same test produces completely different results in different contexts. Your visitors aren’t their visitors.
And a bonus mistake that’s not on this list: 52% of businesses don’t QA their tests before launching them. Always test your test. Open it on your phone. Open it in a different browser. Click every link. Broken tests give you broken data, and you won’t know until it’s too late.
If you want to try split testing your own landing pages, start small. One page, one change, one month. See what happens.
FAQ
How long should you split test a landing page?
Minimum 2 full business cycles, which usually means 2-4 weeks. But DRIP Agency’s data shows the median real-world test runs for 42 days. Patience pays off here.
The real answer depends on your traffic. Use a sample size calculator before you start. At low traffic (under 1,000 weekly visitors to the page), expect 6-8 weeks.
How many visitors do you need for a landing page split test?
At minimum, about 1,000 visitors per version. Convert.com data shows 37% of real-world tests use 10,000-50,000 visitors. Detecting small improvements (5%) requires around 200,000 visitors (Kohavi’s research). For most small businesses, aim to detect 20% or larger improvements. That’s more realistic, and it’s still a meaningful difference.
Is split testing bad for SEO?
No. Google explicitly supports it. Three rules keep you safe: use canonical tags on test versions (tells Google which page is the “real” one), use temporary 302 redirects for URL tests (not permanent 301s), and remove test code after the test ends. Follow those and your rankings stay put.
What is a split test on a landing page?
It’s comparing two versions of a landing page to see which gets more conversions. Half your visitors see Version A, half see Version B. The version that performs better wins. You can test headlines, buttons, images, page layouts, or even entirely different designs. The goal is replacing guesses with data.
What is an example of split testing?
The travel company Going changed their call-to-action button text on a landing page. One change. Same page, same design, just different words on the button. Result: 104% increase in premium trial signups. One line of copy, measured with real visitors, massive impact. That’s split testing at its simplest.

Randy Wattilete
CRO expert and founder with nearly a decade running conversion experiments for companies from early-stage startups to global brands. Built programs for Nestlé, felyx, and Storytel. Founder of Kirro (A/B testing).
View all author posts