The A/B test sample size formula is:
n = (Zα/2 + Zβ)² × [p₁(1−p₁) + p₂(1−p₂)] / (p₁−p₂)²
If that looks like gibberish, you’re not alone. Most articles either throw this formula at you with zero explanation, or skip it and say “just use a calculator.”
This guide does both. We’ll break down every piece in plain English, walk through it with real numbers, then point you to a free sample size calculator so you never do this math by hand. (For a broader overview, see our A/B testing guide.)
Why bother understanding it if a calculator exists? Because the formula tells you why you need a certain number of visitors. It’s a core part of testing methodology. Understanding statistical power and power analysis is the key to that “why.” (After your test ends, the significance calculator tells you whether the results are real, and the power calculator shows whether your test was strong enough to catch a difference.) And if you’re still planning your test, our marketing experiment design framework covers the full process from hypothesis to launch. And it matters when your boss asks why the test needs three more weeks. Or when the calculator says 50,000 visitors and you only get 5,000 a month.
New to split testing? Start there first.
Why the number of visitors matters
Even if all 3 say Coke, that tells you almost nothing. You need a lot more opinions before the answer means something.
Same logic applies to your A/B test. Too few visitors and your “winning” version might just be random noise.
This isn’t a theoretical problem. A meta-analysis of 115 real A/B tests found that 70% were underpowered (not enough visitors to get a reliable answer). The average improvement those tests tried to detect? Just 4%. Way too small for the traffic most sites actually have.
It gets worse. Ronny Kohavi ran experiments at Microsoft for 12 years. He found that roughly one-third of tests show positive results, one-third show nothing, and one-third actually make things worse. At Google and Netflix, only 10-20% of tests produce clear wins.
So when your test “finds a winner” on thin data, be skeptical. There’s a phenomenon called the winner’s curse: the winning version looks WAY better than it actually is. Underpowered studies routinely overestimate their effects by 25-50%, sometimes by nearly 5x.
Your test says Version B gets 30% more signups? On a small sample, the real number might be 5%.
The formula exists to prevent this. It tells you: “here’s how many visitors you need before rejecting the null hypothesis actually means something.”
Our take: If you can’t hit the sample size the formula gives you, that doesn’t mean “don’t test.” It means “adjust your expectations.” More on that below.
The four inputs you need before running the ab test formula
Before you can calculate anything, you need to decide on four things. Two of them you probably already know. Two have standard defaults you can just use.
1. Baseline conversion rate (p₁)
This is your current conversion rate. The one your page already gets, before you change anything. Pull it from Google Analytics. If your checkout page converts 3 out of every 100 visitors, your baseline is 3% (or 0.03 in the formula).
2. Minimum detectable effect, or MDE
The smallest improvement you care about finding. This is a business decision, not a math one. If your page converts at 3%, do you need to detect a tiny 5% relative jump (3.0% → 3.15%)? Or would you only act on a bigger 20% relative improvement (3.0% → 3.6%)?
Smaller MDE = more visitors needed. Bigger MDE = fewer visitors, but you’ll miss the small wins.
A practical rule from Convert.com: aim for 1-2% MDE on high-traffic sites, 5% on mid-traffic sites, and 10%+ if you’re working with lower traffic.
3. False alarm rate (experts call this significance level, or α)
How often you’re willing to celebrate a fake win. The standard is 5% (α = 0.05). That means you accept a 1-in-20 chance that the “winner” isn’t actually better. After your test runs, a p-value calculator tool tells you whether the result clears this bar. Most people just leave this at 5%.
4. Catch rate (experts call this statistical power, or 1−β)
How often you’ll catch a real improvement when one actually exists. The standard is 80%. Jacob Cohen established this default in his 1992 paper “A Power Primer”. His reasoning: missing a real winner is about 4x less costly than chasing a fake one.
Put simply: α is how often you’ll celebrate a fake win. Power is how often you’ll catch a real one. For a deeper dive into how these two error types affect your tests, see our guide on Type 1 vs Type 2 errors.
Quick-reference table: visitors per variation
Don’t want to do the math? Here’s a cheat sheet. Find your baseline conversion rate on the left, your desired MDE across the top, and read off the visitors you need per variation (not total, per version).
| Baseline rate | 5% relative MDE | 10% relative MDE | 20% relative MDE | 50% relative MDE |
|---|---|---|---|---|
| 1% | 3,203,200 | 800,800 | 200,200 | 32,032 |
| 3% | 1,037,748 | 259,437 | 64,859 | 10,378 |
| 5% | 604,510 | 151,128 | 37,782 | 6,045 |
| 10% | 280,566 | 70,142 | 17,535 | 2,806 |
These assume 95% confidence and 80% power (the standard defaults). Notice how quickly the numbers shrink when you’re willing to look for bigger improvements. That’s the tradeoff at the heart of sample size planning.
The sample size formula explained in plain English
The full A/B test sample size formula again:
n = (Zα/2 + Zβ)² × [p₁(1−p₁) + p₂(1−p₂)] / (p₁−p₂)²
Let’s translate each symbol.
- n = visitors per variation (not total visitors, just per version. Multiply by 2 for a standard A/B test.)
- Zα/2 = a lookup number for your false alarm rate. For the standard 95% confidence, it’s 1.96. You don’t calculate this. You just plug it in.
- Zβ = a lookup number for your catch rate. For 80% power, it’s 0.84. Same deal, just plug it in.
- p₁ = your baseline conversion rate (the “before” number)
- p₂ = the conversion rate you’d see if the improvement is real (the “after” number). If your baseline is 3% and you want to detect a 20% relative lift, p₂ = 3.6%.
The top half (the numerator) combines your false alarm protection and your catch rate. The bottom half (the denominator) is about how big a difference you’re trying to detect. Smaller difference = bigger denominator = more visitors needed.
This formula dates back to Casagrande, Pike & Smith (1978), later simplified by Fleiss, Tytun & Ury (1980). It’s the exact same math behind every A/B test calculator out there. Evan Miller, Optimizely, Kirro. All of them.
Quick shortcut for napkin math: For the standard settings (80% power, 95% confidence), you can estimate n ≈ 16/d². Here d is the difference between your two conversion rates, adjusted for spread. Not exact, but handy when you need a quick number on the back of a napkin.
Worked example: from conversion rate to test duration
Scenario: Your landing page converts at 3%. You want to detect a 20% relative improvement (3.0% → 3.6%). You want 95% confidence and 80% power.
Here’s how to calculate sample size for this A/B test:
Step 1: Write down your conversion rates.
- p₁ = 0.03 (your current page)
- p₂ = 0.036 (what you’d see with a 20% improvement)
Step 2: Grab the lookup numbers.
- Zα/2 = 1.96 (for 95% confidence)
- Zβ = 0.84 (for 80% power)
Step 3: Calculate the top of the formula.
- (1.96 + 0.84)² = (2.80)² = 7.84
Step 4: Calculate how spread out your data is (the variance part).
- p₁(1−p₁) = 0.03 × 0.97 = 0.0291
- p₂(1−p₂) = 0.036 × 0.964 = 0.0347
- Sum = 0.0291 + 0.0347 = 0.0638
Step 5: Calculate the difference squared.
- (p₂ − p₁)² = (0.036 − 0.03)² = (0.006)² = 0.000036
Step 6: Put it together.
- n = 7.84 × 0.0638 / 0.000036 = 13,898 visitors per variation
- Total for both versions: 13,898 × 2 = 27,796 visitors
Step 7: Convert to time.
- If your page gets 500 visitors per day: 27,796 / 500 = ~56 days (about 8 weeks)
That’s a real number you can plan around. And it explains why landing page split testing takes patience.
Second scenario for comparison
Same formula, different inputs. Your page converts at 10% and you’re looking for a 10% relative lift (10% → 11%).
- n = 7.84 × [0.10 × 0.90 + 0.11 × 0.89] / (0.01)²
- n = 7.84 × 0.1879 / 0.0001
- n = 14,731 visitors per variation
- At 2,000 visitors/day → about 15 days
Notice something? Both scenarios need roughly the same number of visitors, even though the conversion rates are very different. Higher-converting pages also have more spread in their data. The formula handles this for you. Math is nice like that sometimes.
Our take: If the math above made your eyes glaze over, that’s totally fine. Use the free sample size calculator and let it do the work. The point of showing the math isn’t to make you calculate by hand. It’s so you understand why the calculator gives you the number it does.
What most calculators won’t tell you
Every competing article stops at “use a calculator, done.” But calculators assume perfect conditions. Real tests don’t have perfect conditions.
Three problems bite people constantly. They’re some of the biggest A/B testing mistakes you can make.
Peeking wrecks your results
Checking your test results before you reach the full sample size is called peeking. And it’s a disaster.
Think of it like this. Imagine flipping a coin 100 times to check if it’s fair. But you peek after every 10 flips. If heads is “winning” at any checkpoint, you stop and declare the coin biased.
You’d “prove” a fair coin was rigged way more than 5% of the time.
That’s exactly what happens when you peek at A/B test results. Evan Miller calculated that continuous peeking inflates your false alarm rate from 5% to 26.1%. That’s not a small error. That means roughly 1 in 4 “winners” is fake.
Even Netflix’s engineering team writes about struggling with this problem. If it trips up their data scientists, it’ll trip up the rest of us too.
The fix: Decide your sample size before the test starts. Don’t look at results until you hit that number. Set a calendar reminder, then close the dashboard.
Sample pollution is real
The formula assumes each visitor is counted once, cleanly. Reality is messier.
Some visitors get counted twice. Some disappear halfway through. It’s like running a taste test where people keep switching lines.
CXL found that cookie deletion alone causes about 10% sample dropout over two weeks. Safari deletes first-party cookies after 7 days. Bot traffic sneaks in. Ad campaign spikes skew your visitor mix.
The fix: Plan for 10-20% more traffic than the formula says. And keep tests under 4 weeks when possible. The longer a test runs, the more pollution creeps in. With growing privacy regulations, understanding how cookie consent reduces your testable audience is another factor to build into your sample size planning.
The winner’s curse inflates your results
When a test barely reaches the minimum threshold on thin data, the reported improvement is almost always bigger than reality.
A Nature Reviews Neuroscience study found that underpowered studies routinely overestimate their effects by 25-50%. In A/B testing specifically, Analytics Toolkit found the average real lift across 115 tests was just 4%.
When teams report “30% lifts” from small-sample tests, the real improvement is usually a fraction of that.
Your test says Version B converts 15% better? With a small sample, the truth might be closer to 4%. The smaller your visitor count, the more this exaggeration kicks in.
The fix: Use the sample sizes the formula tells you (which is the whole point of this article). And be skeptical of huge improvements from small tests. If something seems too good to be true with limited data, it probably is.
When you can’t reach the sample size
Most articles about sample size assume you have endless traffic. But if you’re running a small business or startup, the calculator might say you need six months of data. At that point, it’s worth exploring A/B testing alternatives for low-traffic sites.
That doesn’t mean testing is off the table. It means you think differently.
Here’s a quick decision tree:
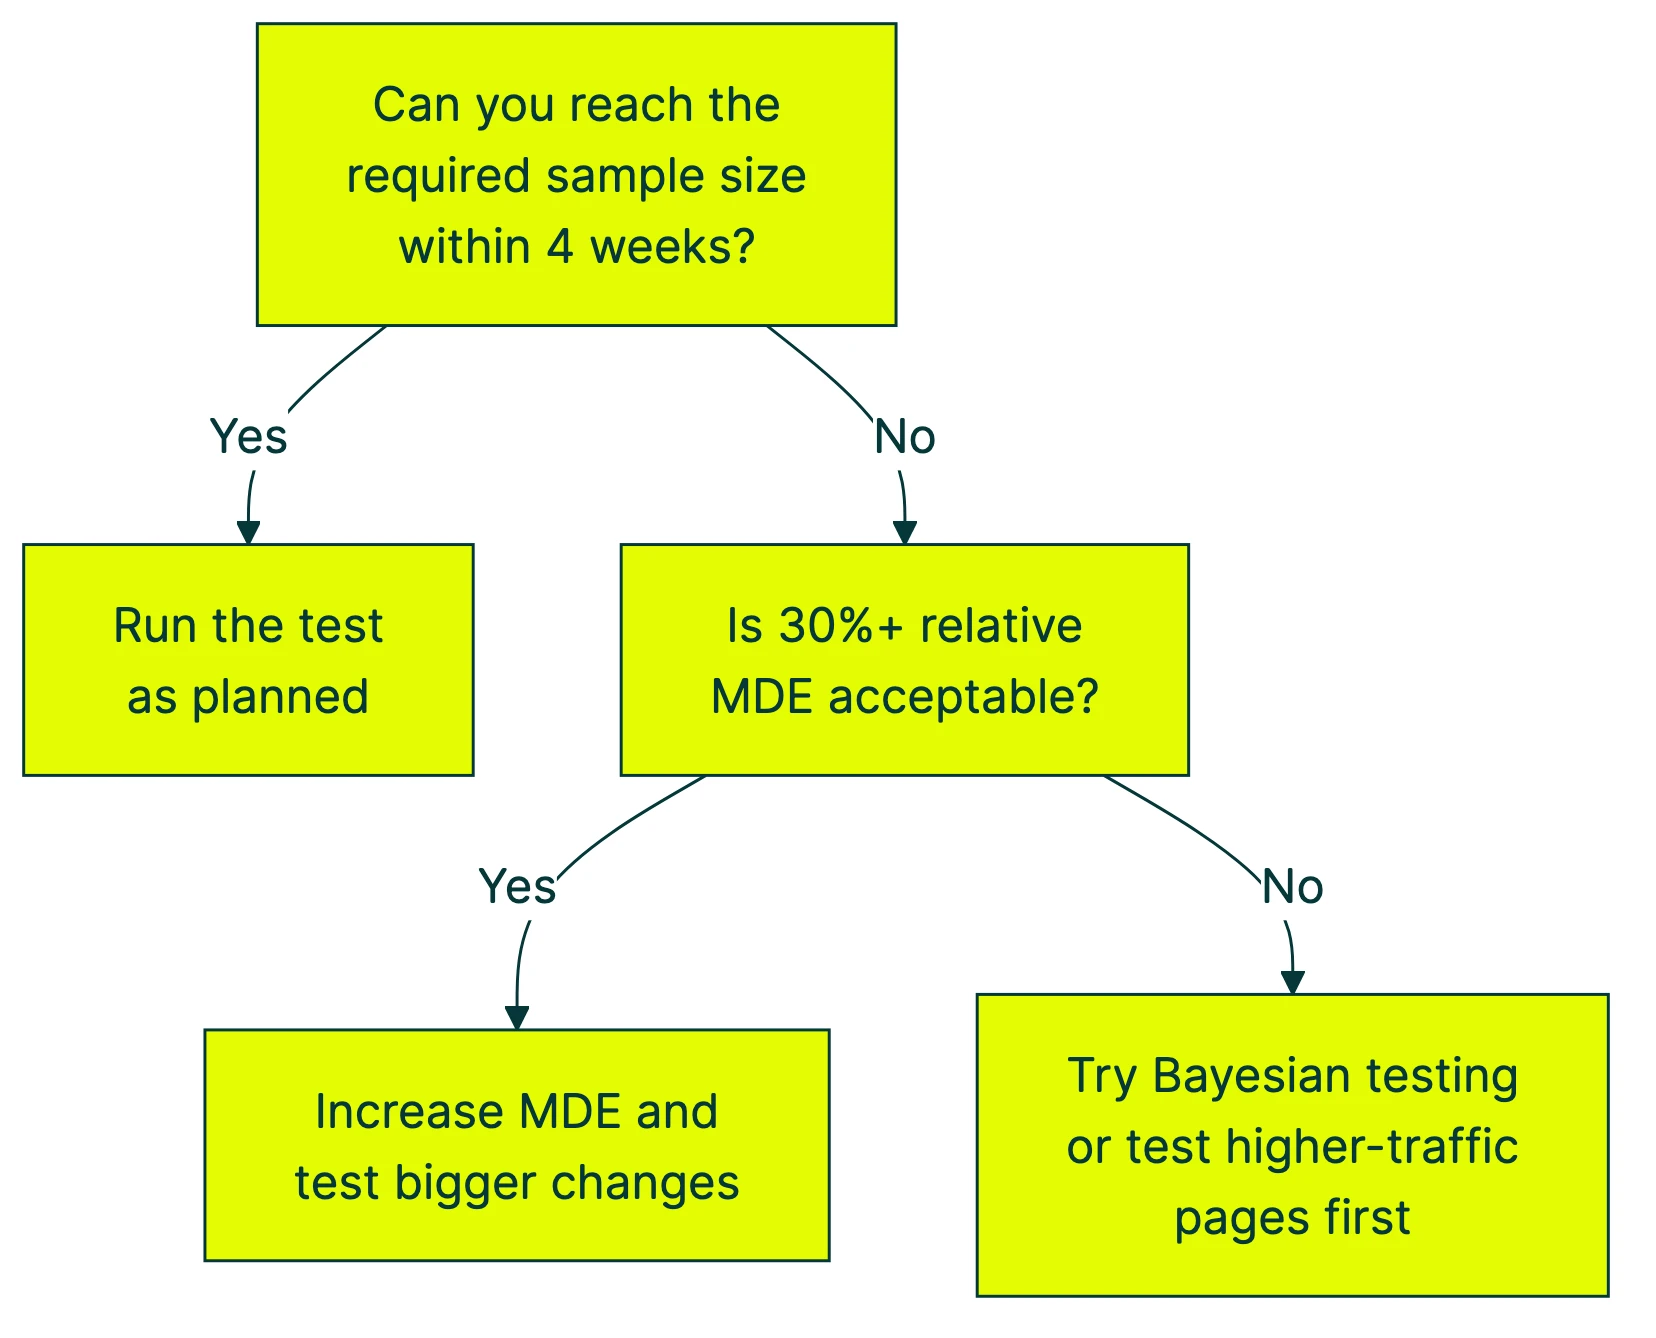
Here’s what you can actually do, ranked by impact:
1. Look for bigger improvements. Instead of trying to detect a 5% lift, aim for 20%+. The numbers drop fast:
- At a 3% baseline, detecting a 5% relative lift needs ~65,000 visitors per variation
- Detecting a 20% lift? About 4,400
- Detecting a 50% lift? Around 720
The tradeoff: you’ll miss small wins. But small wins barely move the needle at low traffic anyway.
2. Test bigger changes. Don’t test button colors. Test entirely different headlines, page layouts, or offers. Bigger changes create bigger effects, which need far fewer visitors. A complete hero section rewrite is more likely to produce a detectable difference than swapping “Buy Now” for “Get Started.”
3. Use math that works with less traffic. The formula in this article is “frequentist,” meaning it needs a fixed visitor count decided upfront. But there’s another approach called Bayesian statistics. The math updates as data comes in, like a weather forecast that gets more accurate over time.
Kirro uses Bayesian statistics for exactly this reason. Instead of “pass or fail after 14,000 visitors,” you get “Version B has a 94% chance of being better” in plain language. Updating in real time.
4. Test higher-traffic pages first. Your homepage probably gets 10x more visitors than your pricing page. Start there. Build confidence and momentum with tests that can actually finish, then work your way to lower-traffic pages.
5. Extend the test duration. Can’t increase traffic? Increase time. Just be careful past 4 weeks, because cookie deletion, seasonal shifts, and changing visitor behavior start polluting your sample.
6. Reduce variance with CUPED. If you have pre-experiment data on your visitors (like past purchase history or browsing behavior), CUPED strips out predictable noise so your test needs fewer visitors to spot a real difference.
Here’s a rough guide based on your monthly traffic:
| Monthly visitors | Realistic MDE to target | What to test |
|---|---|---|
| Under 10,000 | 30%+ relative | Major page redesigns, headline rewrites, offer changes |
| 10,000–100,000 | 9–30% relative | Headlines, layouts, calls to action, pricing display |
| 100,000–1,000,000 | 2–9% relative | Smaller refinements, copy tweaks, form fields |
The same logic applies to mobile app A/B tests, where daily active users determine your realistic MDE.
If you’re at the lower end, you can set up a free test with Kirro and let the Bayesian math work with whatever traffic you have. No PhD required.
Peeking with a safety net (and Bayesian alternatives)
The standard formula assumes you pick a number, run the test to that number, then look at the results. One look. That’s it. But real humans check their dashboards constantly. Two approaches address this.
Sequential testing builds a mathematical correction into the peeking process. You can check at planned intervals without inflating your false alarm rate. The tradeoff: it cuts sample size by about 26%, but increases the chance of missing a real winner by 123%. Faster finish, but more “no winner” calls when a winner actually existed.
Bayesian testing flips the question. Instead of “is there a significant difference?” it asks “what’s the probability that Version B is better?” You get a running probability that updates with every new visitor. No fixed sample size needed.
Kirro uses the Bayesian approach. You see something like “Version B has a 91% chance of being better.” That number moves as more data comes in. When it’s high enough for you to feel confident, you make the call. It’s where most A/B testing software is heading.
For a deeper look at this approach, we’ll cover it in our upcoming guide to Bayesian A/B testing.
How to use a sample size calculator (step by step)
You don’t need to run this formula by hand. Here’s how to use Kirro’s free sample size calculator (or any other calculator, they all use the same math):
-
Find your baseline conversion rate. Open Google Analytics. Go to the page you want to test. Look at the conversion rate over the last 30 days. That’s your baseline.
-
Choose your MDE. How much improvement would matter enough to keep the new version? If you’re not sure, start with 10-20% relative. You can always adjust.
-
Keep the defaults for confidence (95%) and power (80%). Unless you have a specific reason to change them, these are the standard settings that the entire industry uses.
-
Read the output. The number you get is visitors per variation, not total. This is the most common mistake people make.
-
Calculate test duration. Divide the total visitors needed (per variation × number of versions) by your average daily traffic. That’s how many days you need.
For example: 14,000 per variation × 2 versions = 28,000 total. At 1,000 visitors per day, that’s 28 days minimum. Never run for less than one full week to capture weekday/weekend patterns. And never stop early just because the numbers look promising.
If you’re also considering testing multiple things at once, keep in mind that each additional version multiplies your sample size needs. Our multivariate testing software guide covers which tools handle those traffic requirements best.
Most A/B testing tools have built-in calculators. Kirro’s calculator is free and doesn’t require signup. Or if you want to run the formula in Excel, paste this into a cell:
=((NORM.S.INV(1-0.05/2) + NORM.S.INV(0.80))^2 * (0.03*(1-0.03) + 0.036*(1-0.036))) / (0.036-0.03)^2
That gives you the same 13,898 we calculated in the worked example. Replace the 0.03 and 0.036 with your own conversion rates.
And honestly, if all this feels like more math than you signed up for, you can skip the formula entirely. Set up a test in Kirro and it handles the statistics for you. Three minutes. No spreadsheet required.
FAQ
What is the minimum sample size for A/B testing?
There’s no universal minimum. It depends on your conversion rate, how big an improvement you’re looking for, and your confidence settings.
Ballpark: a site with a 3% conversion rate looking for a 20% relative improvement needs about 14,000 visitors per variation. At 10% conversion rate looking for 10% relative improvement, about 15,000 per variation. Use the sample size calculator for your exact number.
How many visitors do I need for an A/B test?
It depends on four things: your current conversion rate, the smallest improvement worth detecting, your confidence level, and your power setting.
A site converting at 5% that wants to detect a 10% relative lift needs roughly 31,000 visitors per variation (62,000 total). Higher conversion rates or bigger expected improvements mean fewer visitors. Lower rates or smaller improvements mean more.
How long should I run my A/B test?
Divide your required sample size by your daily traffic. If you need 28,000 total visitors and get 1,000 per day, that’s 28 days minimum.
Two rules: never run less than one full business cycle (usually 7-14 days) to capture weekday/weekend patterns. And never stop early just because results look good. That’s peeking, and it wrecks your results. For more on timing, see our guide on A/B testing and conversion rate.
Can I use the A/B test formula in Excel?
Yes. Paste this into a cell:
=((NORM.S.INV(1-alpha/2) + NORM.S.INV(power))^2 * (p1*(1-p1) + p2*(1-p2))) / (p2-p1)^2
Replace alpha with 0.05, power with 0.80, p1 with your baseline rate (like 0.03), and p2 with your target rate (like 0.036). NORM.S.INV gives you those Z-score lookup numbers automatically.
What is the difference between one-tailed and two-tailed tests?
A two-tailed test checks if Version B is different from Version A in either direction (better or worse). A one-tailed test only checks one direction (is B better?).
Two-tailed is the standard. Most calculators default to it. It needs slightly more visitors, but it’s safer because it catches cases where your change accidentally makes things worse. Stick with two-tailed unless you have a strong reason not to.
Do SEO A/B tests use the same formula?
Not quite. SEO A/B testing works at the page level (comparing groups of similar pages), not at the visitor level. The sample size there is about pages, not people.
Different math, same core idea: you need enough data points before the result means anything.
What if my test finishes but there’s no clear winner?
That’s not a failure. It means both versions perform about the same. Your original was already decent.
Try a bigger change next time, or test a different element. Most tests don’t produce a clear winner. Even at Google and Microsoft, only 10-20% of tests show positive results. “This change doesn’t matter” is still useful information for your overall CRO strategy.

Randy Wattilete
CRO expert and founder with nearly a decade running conversion experiments for companies from early-stage startups to global brands. Built programs for Nestlé, felyx, and Storytel. Founder of Kirro (A/B testing).
View all author posts