CUPED is a technique that uses what your visitors did before your test started to filter out noise in your results. It stands for Controlled-experiment Using Pre-Experiment Data. And it can cut the time your A/B tests need to reach confident results by up to half.
The catch? That “up to half” part does a lot of heavy lifting. Sometimes CUPED barely helps at all. Sometimes it’s a game-changer. The difference depends on how predictable your visitors’ behavior is, and most articles about CUPED skip that part entirely.
What actually happens, when it works, when it doesn’t, and why 60 years of medical research says you can trust the testing methodology.
What is CUPED in A/B testing?
Every visitor to your site is different. Some people buy everything they click on. Others window-shop for three hours and leave. That natural variation (the technical term is “variance”) makes it hard to tell whether your new headline actually worked. Maybe Version B just happened to get more big spenders.
CUPED fixes this by looking at each visitor’s behavior before the test. If someone was already buying a lot, CUPED adjusts for that. If someone never buys anything, CUPED adjusts for that too. You’re left comparing apples to apples instead of apples to a random basket of fruit.
Think of it like grading on a curve. If a student always scored 90%, and they score 92% after a new teaching method, that 2-point bump might actually matter. If a student who usually scores between 40% and 95% scores 92%, you can’t tell if the method helped or they just had a good day. CUPED is the curve.
Microsoft invented CUPED in 2013 for their Bing search experiments. Their original tests showed a 45-52% reduction in noise. Netflix, Booking.com, LinkedIn, DoorDash, and Etsy all adopted it. It’s how most big tech companies speed up their split tests today.
The practical promise: same reliable results with roughly half the visitors. Or the same visitors, but you get answers in half the time. Either way, your tests run faster without sacrificing statistical power. (Use the power calculator to see how much power you gain from reduced variance.)
How CUPED reduces variance (plain English)
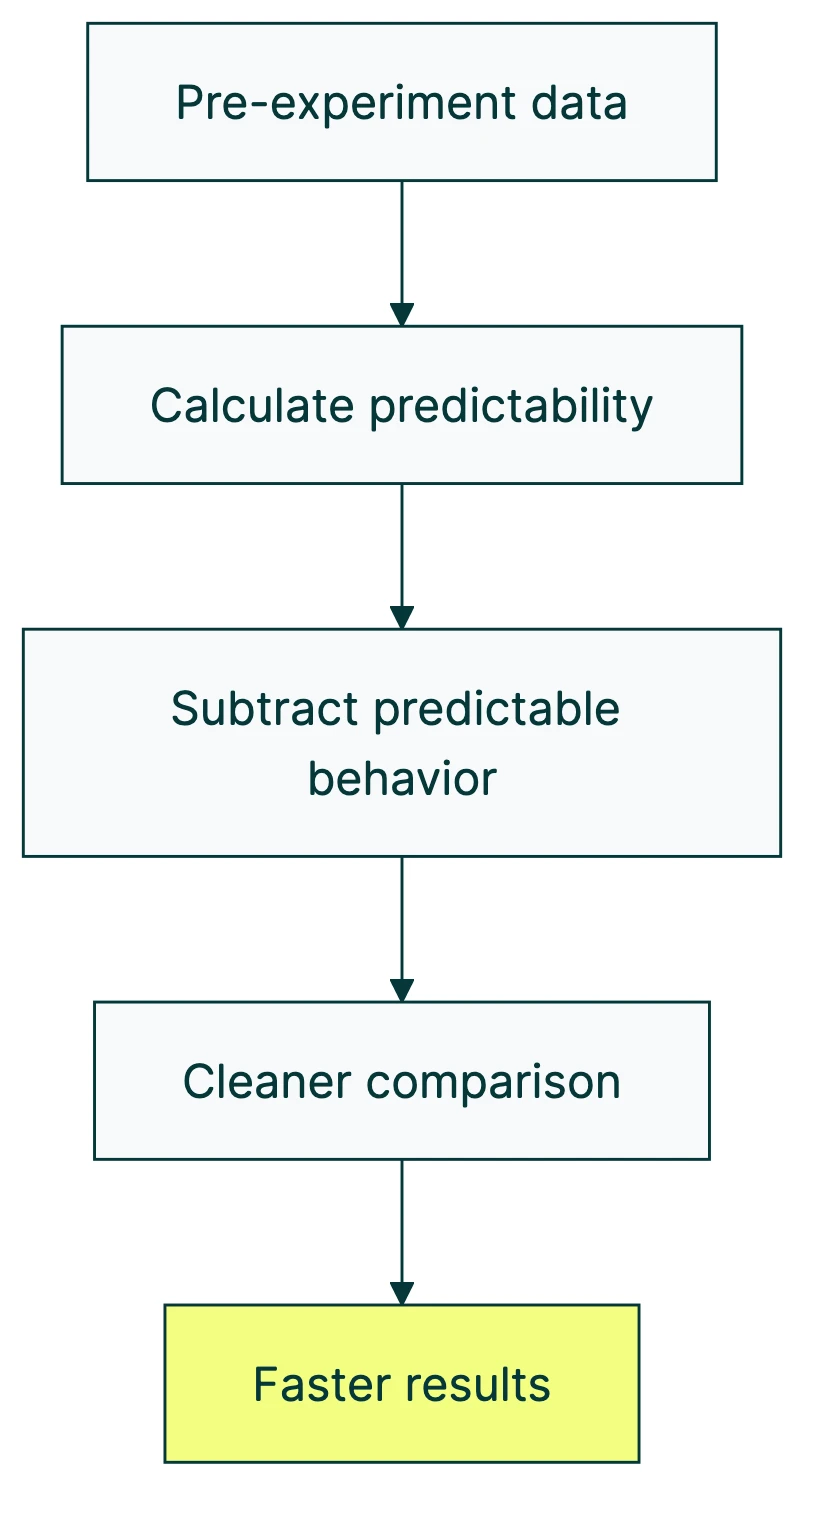
The four-step version:
- Look back. Before the test starts, CUPED checks each visitor’s recent behavior. How much did they spend last week? How many pages did they view? How often did they visit?
- Measure predictability. It calculates how much of their in-test behavior is just “them being them.” A visitor who spends €50 every week and then spends €52 during the test? Mostly predictable.
- Subtract the noise. CUPED removes that predictable part from the results. What’s left is the actual impact of your test change.
- Compare cleaner data. Now when you compare Version A to Version B, there’s less random wobble drowning out real differences.
The whole thing hinges on one number: how correlated someone’s past behavior is with their test behavior. Statisticians call this correlation coefficient “rho” (ρ), but you can think of it as predictability.
If your visitors are very predictable week to week (ρ = 0.7), CUPED removes about 49% of the noise. If they’re unpredictable (ρ = 0.2), it only removes about 4%. The formula is simple: noise reduction = ρ².
Our take: The math is straightforward, but you don’t need to calculate anything yourself. The point is that CUPED helps most when your visitors behave consistently. If your audience is all over the place, CUPED won’t save you.
So what does “predictable” look like? Revenue per visitor, pages viewed per session, and time on site tend to be stable week over week. These are the metrics where CUPED shines. It can shrink your required sample size and help you detect a smaller minimum detectable effect.
For the formula-curious, the actual math:
Variance after CUPED = Variance before × (1 - ρ²)
If your original metric has a variance of 100 and the correlation between pre-test and in-test behavior is 0.7: new variance = 100 × (1 - 0.49) = 51. You just cut the noise roughly in half.
When CUPED works best (and when it doesn’t)
This is the part most CUPED articles skip, and it’s the part that matters most if you’re deciding whether to rely on it.
Where CUPED helps:
- Revenue per visitor (high week-to-week stability)
- Page views per session
- Session duration
- Engagement scores
- Any metric where people tend to behave similarly week after week
Where CUPED struggles:
- Yes/no conversion metrics (bought or didn’t buy, signed up or didn’t)
- Rare events like annual purchases
- Tests on mostly new visitors (CUPED needs history, and new visitors don’t have any)
- Short tests without enough lookback data
That second point deserves attention. If you’re running a small business, your number one metric is probably conversions. Did someone buy? Did someone fill out the form?
These are yes/no outcomes (statisticians call them “binary metrics”), and CUPED is weak here. The correlation between “did they buy last week” and “did they buy this week” just isn’t high enough for most sites.
The 50% claim is a ceiling, not a floor
Every vendor article about CUPED leads with the same number: “50% variance reduction.” That’s from the original Bing paper, and it’s real. But it’s the best case on specific metrics at Microsoft scale.
The real-world numbers tell a different story.
Nubank (a Brazilian fintech with 70+ million customers) published their results. Of all the metrics they tested CUPED on, only 40% saw a meaningful improvement (more than 20% noise reduction). Almost half (48%) saw less than 10% improvement. And 12% of their metrics had no pre-test data at all, so CUPED couldn’t even run.
Microsoft’s own research team found that on one product, 68% of metrics showed near-zero benefit from CUPED.
A study that pooled results from 50 clinical trials using the same underlying math (more on that later) found the median noise reduction was just 13.3% for continuous outcomes.
Our take: The “CUPED cuts your test time in half” claim is marketing. Sometimes it does. Often it doesn’t. Check whether your specific metric is predictable before counting on it. Honest results beat flattering promises.
CUPED vs other variance reduction methods
CUPED isn’t the only noise reduction technique in modern experimentation. It was the first practical method, but the field has moved on. The main approaches, and when to use each one:
| Method | How it works | Best for | Limitation |
|---|---|---|---|
| CUPED | Adjusts for pre-test behavior using simple math | Returning visitors with stable metrics | Doesn’t help with new visitors or yes/no outcomes |
| CUPAC | Uses machine learning instead of simple math to predict behavior | Same as CUPED but captures more patterns | Needs an ML model, more complex to build |
| Post-stratification | Sorts visitors into groups (new vs returning, mobile vs desktop) and compares within groups | New visitors, mixed audiences | Less powerful than CUPED for returning visitors |
| In-experiment VR | Uses leading indicators during the test itself | Rare events, delayed outcomes | Newest method, less widely adopted |
CUPAC (Control Using Predictions As Covariates) is CUPED’s evolution. DoorDash built it because simple linear math leaves patterns on the table. Their ML-based approach gave them 15-20% more noise reduction than CUPED and shortened their tests by 25%.
The really interesting development is in-experiment variance reduction. Microsoft’s team published this at KDD 2023, and it works for exactly the metrics where CUPED fails. Instead of using pre-test data, it uses leading indicators from the test itself. Got a sparse metric like monthly purchases? This method uses daily site visits during the test to reduce noise in the purchase data. It achieved 50%+ noise reduction on metrics where CUPED was useless.
Nobody else covers this full evolution: CUPED (2013) → CUPAC (2020) → in-experiment VR (2023) → combined approaches (2024, Etsy and Stanford). Each one solved a limitation of the one before it.
The simple decision:
- Returning visitors with stable behavior? CUPED.
- New visitors or mixed audiences? Post-stratification.
- Rare or delayed outcomes? In-experiment methods.
- Want the best of everything? Combined pre + in-experiment approaches.
If you’re running tests on a small business site using A/B testing software, you probably won’t configure any of this manually. Good tools handle it for you.
The science behind CUPED (why you can trust it)
Most CUPED articles frame it as a tech industry breakthrough. It’s not. Microsoft named it in 2013, but the math is much older.
CUPED is identical to ANCOVA (Analysis of Covariance). Clinical trial researchers have used ANCOVA since the 1960s. When drug companies test whether a new medicine works, they adjust for each patient’s baseline health before the trial. That’s exactly what CUPED does with visitor behavior. Same math, different name tag.
A review pooling 50 randomized clinical trials confirmed this adjustment reduces noise by 4-32%, depending on the metric. A 2025 study across 50 more trials confirmed the same thing: ANCOVA (CUPED’s real name) is the best simple approach when a change affects everyone equally.
Why does this matter for your A/B tests? Two reasons:
It’s safe. CUPED is mathematically unbiased. It can make your results more precise, but it can never create false winners or false losers. It can’t introduce Type 1 or Type 2 errors. Worst case? It provides zero benefit. Never harm.
It’s proven. The same approach that decides whether heart medications reach the market is making your A/B test results more reliable. That’s 60 years of peer-reviewed evidence, not marketing. When your testing tool says the null hypothesis is rejected, CUPED makes that call sharper. Kind of reassuring that the math behind your headline test also validated blood pressure medication.
How modern A/B testing tools handle CUPED
CUPED used to be something only Netflix and Microsoft could build. Now it’s table stakes for serious testing platforms. Statsig, GrowthBook, Amplitude, Optimizely, and Eppo all include some version of variance reduction.
The typical setup: the tool takes a 7-day window of pre-test behavior and uses the same metric you’re testing as the adjustment variable (called a “covariate”). It calculates how much to adjust automatically. You don’t touch any of this.
The problem? These tools charge thousands per year. Statsig’s free tier caps at 2 million events. GrowthBook Pro starts at real money. Amplitude Experiment is built for large engineering teams. If you’re a marketer at a 20-person company, you’re not their customer.
Kirro takes a different approach. The math runs automatically. You don’t pick covariates, set lookback windows, or configure anything. You set up a test, and the system applies variance reduction when it helps. Combined with Bayesian statistics (math that works with less traffic), it means faster, more reliable results without a statistics degree.
If you’re curious whether your tests could run faster, try it free for 30 days. No credit card needed.
How to know if CUPED will help your tests
Before you get excited about halving your test duration, run through this checklist:
Do you have returning visitors? CUPED needs history. If your site is mostly first-time visitors (think: paid ad landing pages for cold traffic), there’s no “pre-experiment data” to work with. CUPED does nothing.
Is your key metric stable week to week? Check whether people who spend a lot one week also spend a lot the next. Revenue per visitor: usually stable. First-time purchases: not so much. The more predictable the metric, the more CUPED helps.
Are you testing on enough traffic? CUPED reduces noise, which means you need fewer visitors for confident results. But if your traffic is very low (under 500 visitors a week), you might still need to wait, just less time than before. When designing your test, plan for this.
Is your test running long enough? CUPED typically needs a 7-day lookback window. If your test runs for just 3 days, there isn’t enough history to adjust with.
Rule of thumb: if 50%+ of your test visitors have 7+ days of prior activity on your site, CUPED will likely help. If that number is below 30%, look at post-stratification or just plan for a longer test.
And if your traffic makes every test feel like it takes forever? That’s the exact problem variance reduction solves. Even a modest 15-20% noise reduction means reaching confident results days or weeks earlier. Set up a test with Kirro and the system handles the math automatically.
What about conversion rate tests?
This is the honest answer that most CUPED articles avoid. If your main metric is conversion rate (did they buy or not, did they sign up or not), CUPED will help less than the headline numbers suggest.
Why? Because yes/no outcomes just aren’t very predictable week to week. Someone who bought last Tuesday might not buy this Tuesday. The correlation is low, and low correlation means low noise reduction.
That doesn’t make CUPED useless for conversions. It just means you might see 5-15% noise reduction instead of 50%. Still helpful, just not the miracle the marketing promises. Combined with other techniques (like Bayesian statistics and smart traffic allocation), it all adds up.
Avoid these common mistakes with variance reduction
If you’re running A/B tests on a small to mid-size site, here are the mistakes people make with variance reduction:
Assuming the 50% number applies to you. That number comes from Microsoft’s Bing metrics with millions of daily visitors and highly stable engagement data. Your mileage will vary. Check whether your metric has high week-to-week correlation before shortening your planned test duration.
Forgetting about new visitors. Running landing page tests from paid ads? Most visitors are new. CUPED literally can’t help with people who have no history. Also consider whether cookieless tracking affects your ability to identify returning visitors.
The lookback window matters too. Seven days is the standard, but it depends on your business cycle. Monthly billing? You might need 28-42 days of pre-test data. Nubank found that extending their window to 42 days improved results.
There’s also a subtler problem: faster tests might detect temporary effects, not lasting ones. If CUPED helps you reach confidence in 5 days instead of 14, make sure you’re measuring something durable. A novelty effect can look like a real win on day 5 and vanish by day 14.
And the opposite mistake? Ignoring variance reduction entirely. Even 15% noise reduction means 15% fewer visitors needed. Over a year of testing, that adds up to weeks of saved time. Not magical. Still worth it.
FAQ
What is CUPED in A/B testing?
CUPED (Controlled-experiment Using Pre-Experiment Data) uses visitors’ behavior from before the test to reduce noise in your results. Microsoft invented it in 2013, and most major tech companies use it now. It typically gets you reliable results with 20-50% less traffic, though the actual benefit depends on how predictable your specific metric is. It’s the same math (called ANCOVA) that clinical researchers have used for 60+ years to test medicines.
How does variance reduction speed up A/B tests?
Random differences between your visitors (noise) are the main reason A/B tests take so long. The more noise, the more visitors you need to tell whether a change actually worked. Variance reduction strips out the predictable part of that noise. If you know a visitor always spends €50 a week, you don’t need to treat their €50 purchase during the test as new information. Remove that predictable behavior, and the real signal from your test shows up faster. In practice, this can cut your required number of visitors by 20-50%.
Do I need CUPED for my A/B tests?
It depends. If you have decent traffic (1,000+ visitors per week), returning visitors with predictable behavior, and you’re measuring engagement metrics like revenue or page views, CUPED helps. If you’re testing with mostly new visitors or measuring rare events, it won’t do much. Modern tools like Kirro handle this automatically. You don’t configure anything. The system applies variance reduction when it helps and skips it when it won’t.
What’s the difference between CUPED and CUPAC?
CUPED uses simple linear math to adjust for pre-test behavior. CUPAC (Control Using Predictions As Covariates) uses machine learning instead, which captures more complex patterns. DoorDash pioneered CUPAC and saw 15-20% more noise reduction than standard CUPED. CUPAC shortened their tests by 25%. Think of CUPED as a ruler and CUPAC as a laser measure. Both measure distance, one’s just more precise. For most small to mid-size sites, the difference between them is marginal.
Can CUPED give wrong results?
No. CUPED is mathematically unbiased. It can make your confidence intervals narrower (good) but cannot create false winners or false losers. The same property has been proven in 60+ years of clinical trial research using the equivalent technique (ANCOVA). The worst case is that CUPED provides no benefit. It can’t mislead you.
Does CUPED work for multivariate testing?
Yes. Variance reduction applies to any controlled test, not just simple A/B comparisons. If you’re testing multiple changes at once, CUPED reduces noise in each comparison. The benefit is the same: less noise means you need fewer visitors per variation. Since multivariate tests already need more traffic (you’re splitting visitors across more versions), any noise reduction is welcome.
Is CUPED the same as sequential testing?
No. They solve different problems. CUPED reduces noise so you need fewer visitors total. Sequential testing lets you check results early and stop as soon as there’s a winner, without inflating your error rate. They’re complementary. You can use both: CUPED reduces the noise, and sequential testing lets you stop the moment you have enough clean data. Think of CUPED as needing a smaller bucket and sequential testing as knowing exactly when the bucket is full.

Randy Wattilete
CRO expert and founder with nearly a decade running conversion experiments for companies from early-stage startups to global brands. Built programs for Nestlé, felyx, and Storytel. Founder of Kirro (A/B testing).
View all author posts