Minimum detectable effect (MDE) is the smallest real improvement your A/B test can reliably catch. If your page actually converts 5% better but your test’s MDE is 10%, you’ll miss the improvement entirely. The test will say “no winner” even though there was one.
Most teams pick an MDE of 5% or 10% because it sounds reasonable. They don’t check whether their traffic can support it. Or whether the improvement they’d detect is even worth caring about. That’s how you end up running tests for weeks and learning nothing. It’s one of the most common A/B testing mistakes, and getting your testing methodology right starts here.
What is minimum detectable effect (and why most teams get it wrong)
Think of MDE like the resolution on a camera. A low-resolution camera can spot a bear in the photo but misses the bird in the tree. A high-resolution camera catches both. MDE is how “sharp” your test is. Set it too high and you’ll only catch big, obvious improvements. Set it right and you’ll catch the smaller wins too.
MDE is not the lift you’re hoping for. It’s a property of your test design, driven by your traffic, your current conversion rate, and how long you run the test.
When you tell a sample size calculator “I want to detect a 5% improvement,” you’re setting the MDE. You’re saying: “make this test sharp enough to catch a 5% change.” The calculator then tells you how many visitors you need.
Get this wrong and the consequences are real. Research by Gelman and Carlin found that underpowered tests inflate results by up to 8x. Your “30% winner” might actually be a 5% improvement. You’d ship the change expecting a huge lift. Revenue barely moves. And you’d have no idea why.
Our take: MDE is probably the most overlooked setting in A/B testing. Teams spend hours designing variations, then spend zero minutes checking whether their test can actually catch the improvement they care about. That’s like buying a telescope and never adjusting the focus.
One more thing. The 80% power and 95% confidence defaults that every calculator uses? Jacob Cohen, the statistician who proposed them in 1988, said they were arbitrary. Meant to be overridden. Almost nobody overrides them. They just click “calculate” and move on.
How MDE connects to sample size, power, and test duration
MDE doesn’t exist in a vacuum. It’s connected to four things, and changing any one changes the others:
Your baseline conversion rate matters most. A page converting at 10% needs fewer visitors to spot a change than one converting at 1%. Then there’s traffic volume: more visitors per week means you can detect smaller changes.
The other two are settings you probably won’t touch. Confidence level (how sure you want to be it’s not a fluke) defaults to 95%. Statistical power (the chance your test catches a real improvement) defaults to 80%.
That means if there’s a real improvement, your test catches it 8 out of 10 times. The other 2 times? Those are type 2 errors . You’re failing to reject the null hypothesis even though it’s false. A real winner slips through.
The relationship is simple: lower MDE = more visitors = longer test. Higher MDE = faster test but you miss smaller improvements.
Real numbers: your pricing page converts at 3%. You get 5,000 visitors per month. At 80% power and 95% confidence, your MDE is roughly 20% relative. You can only detect changes from 3.0% to 3.6% or bigger. Anything smaller hides in the noise.
For the full math behind power analysis and sample size calculations, we’ve covered those in separate guides. Or use the power calculator to see how MDE and power interact for your specific numbers. Here, we’re focused on choosing the right MDE, not calculating it by hand.
When you set up a test in Kirro, it uses your traffic data and conversion rate to tell you how long the test needs to run. The MDE math happens behind the scenes. No spreadsheets required.
Absolute vs relative MDE: the difference that trips everyone up
When someone says “we need a 10% MDE,” they could mean two completely different things:
Relative MDE (most common): 10% of your current rate. If your conversion rate is 3%, a 10% relative MDE means detecting a change from 3.0% to 3.3%. That’s a 0.3 percentage point improvement. Small.
Absolute MDE: 10 percentage points. If your conversion rate is 3%, a 10% absolute MDE means detecting a change from 3.0% to 13.0%. That’s massive. And for most tests, completely unrealistic.
See the problem? One version is looking for a subtle shift. The other is looking for a complete transformation. Same number, totally different tests.
| Relative MDE (10%) | Absolute MDE (10%) | |
|---|---|---|
| Baseline: 3% conversion | Detects 3.0% → 3.3% | Detects 3.0% → 13.0% |
| Baseline: 15% conversion | Detects 15.0% → 16.5% | Detects 15.0% → 25.0% |
| Baseline: 50% conversion | Detects 50.0% → 55.0% | Detects 50.0% → 60.0% |
| How realistic? | Normal for A/B tests | Only for dramatic redesigns |
Most calculators default to relative MDE. But they don’t always tell you that. Datadog’s documentation is one of the few that explicitly states it uses relative MDEs. Everyone else leaves you guessing.
The rule: whenever someone says “5% MDE” or “10% MDE” without specifying, ask which kind. And when you’re using a calculator, check the label next to the input field. Getting this wrong means your test is designed for a completely different detection threshold than you intended.
Our take: Every MDE conversation should start with one word: “relative” or “absolute.” Skip that and you might design a test for a 3% → 3.3% shift while the calculator thinks you want 3% → 13%. We’ve seen teams waste months on this.
How to choose the right MDE for your business
Most guides tell you what MDE is. Show you the formula. Then leave you staring at a calculator wondering what number to type in.
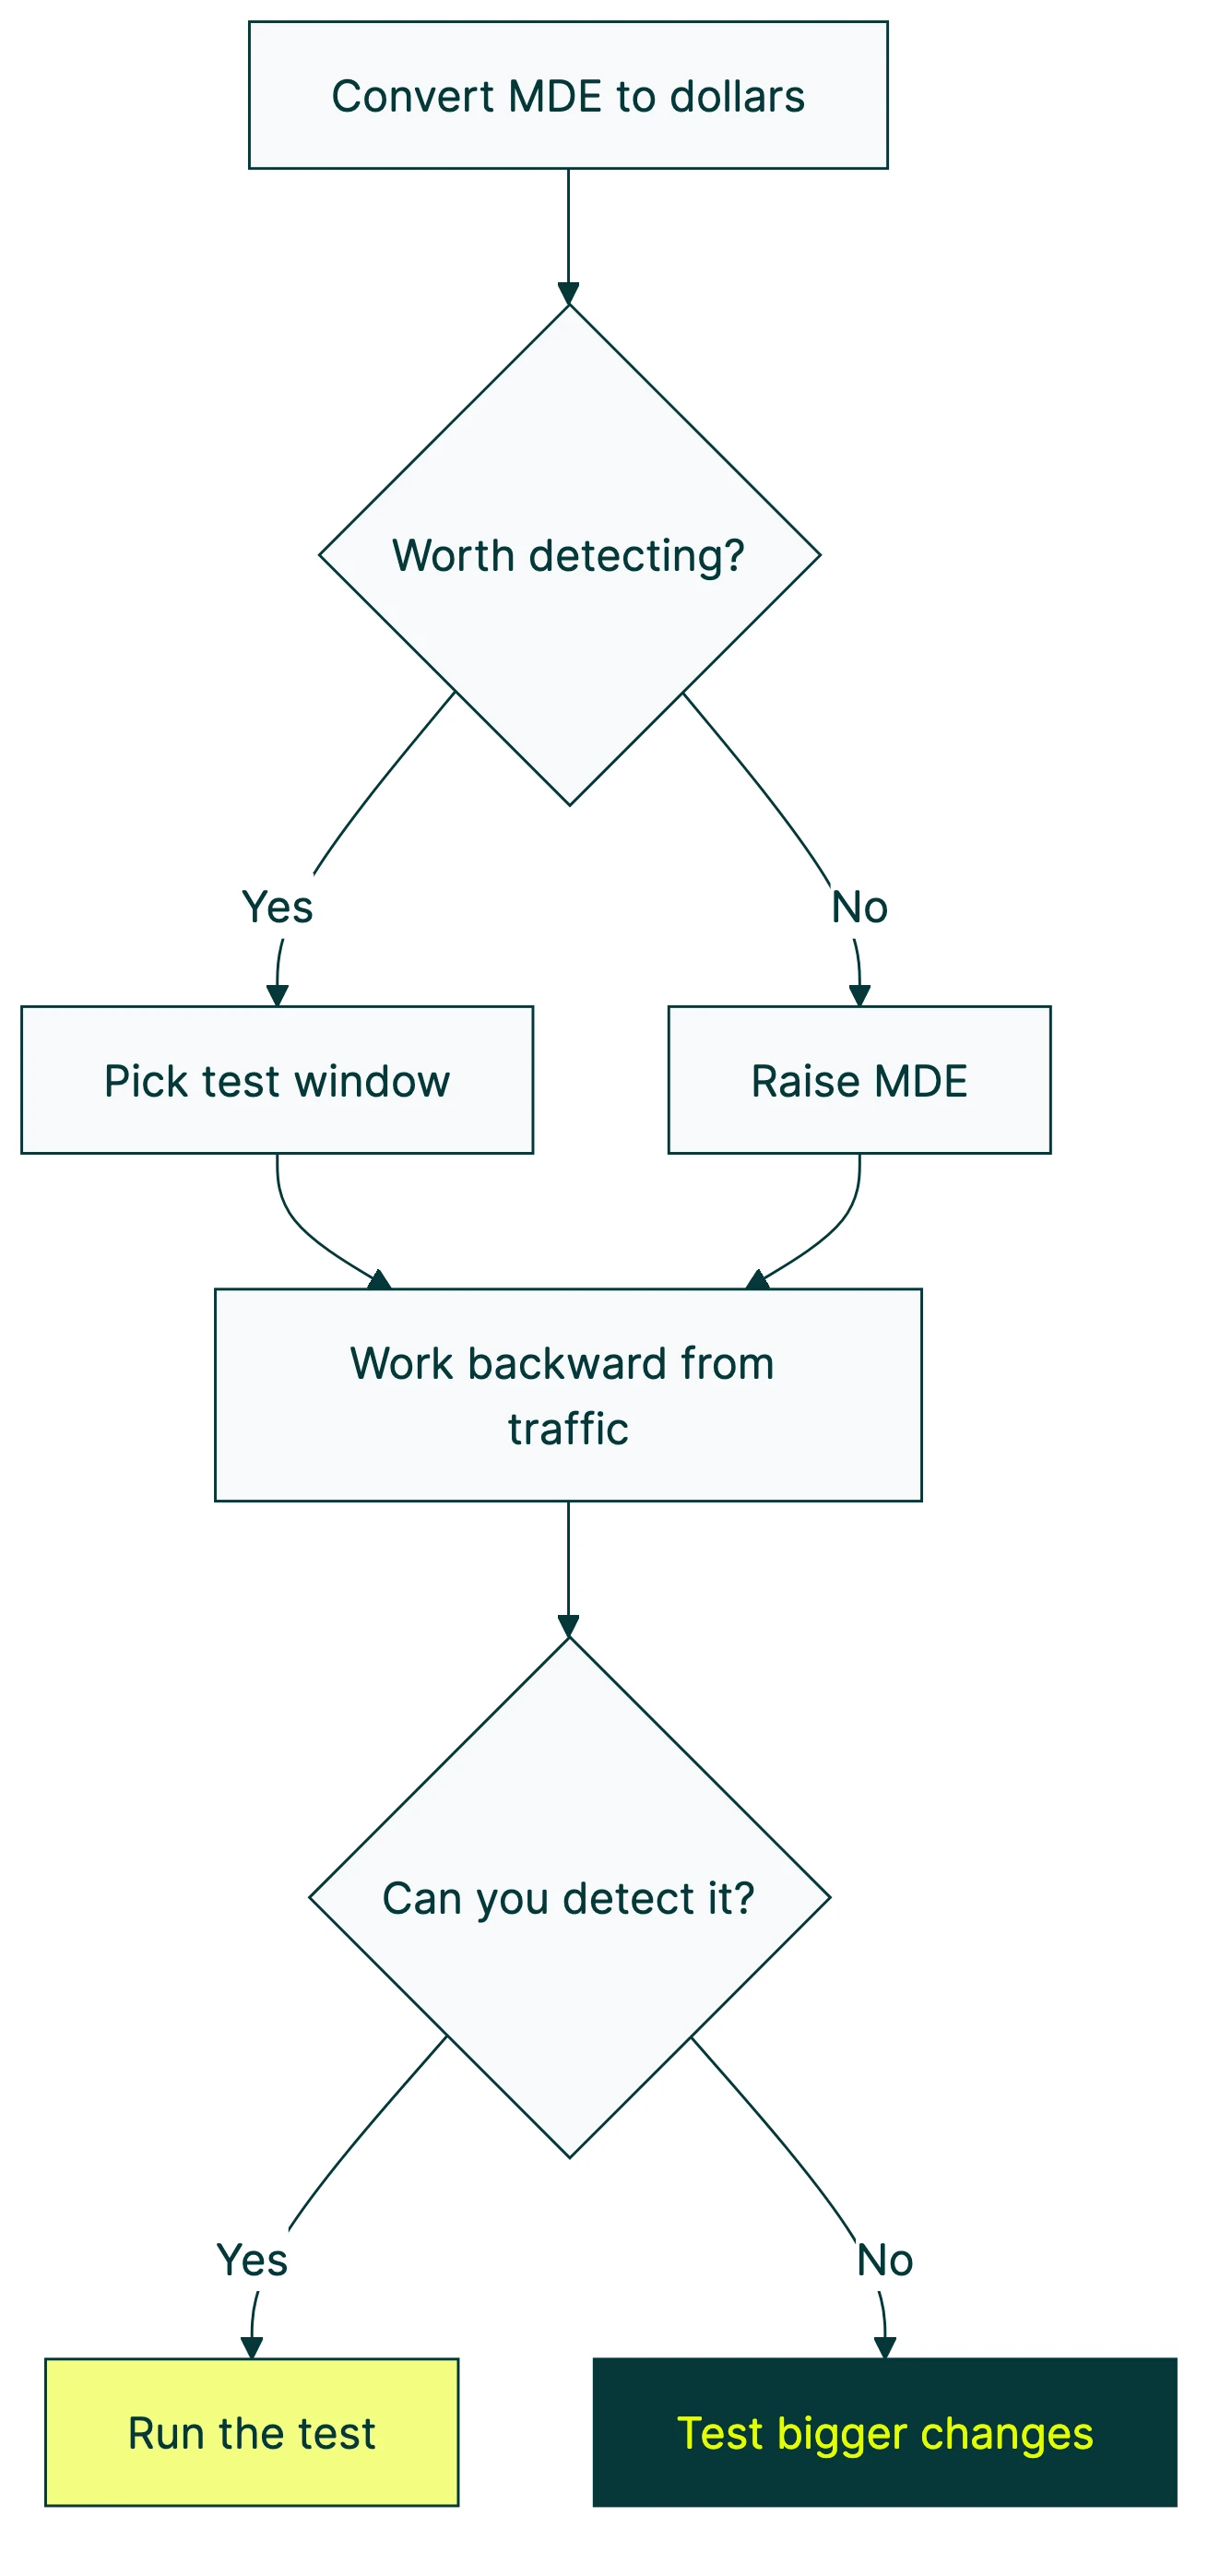
Four steps that actually work:
Step 1: Convert MDE to dollars.
Your pricing page makes $100,000 per year. If your MDE is 10% relative, you’re asking: “Is a $10,000/year improvement worth detecting?” If yes, run the test. If $10,000 feels too small to care about, raise your MDE and save time.
This is the framing that matters. Percentages are abstract. Dollars are real. Booking.com sets their MDE as “0.2% lift in completed bookings” because they’ve translated that percentage into actual revenue. Twitter’s engineering team calibrated their MDE around 1.5% based on historical data showing that real effects rarely exceed 5%.
For most small businesses, the math looks different. You’re not Booking.com. Your traffic is lower and your per-visitor revenue might be higher. The dollar translation still works though.
Step 2: Pick a test window.
Two to four weeks is the sweet spot. Shorter and you’ll hit weekday-vs-weekend traffic problems. Longer and you’re paying an opportunity cost (you could be running the next test). When you design your experiment properly, building in full weekly cycles matters.
Step 3: Work backward from your traffic.
Given your visitors and baseline conversion rate, what MDE can you detect in your chosen window? Use a calculator (more below) or let your A/B testing tool figure it out.
Rough guide:
| Monthly visitors | 2-week MDE | 4-week MDE |
|---|---|---|
| 1,000 | ~45% relative | ~30% relative |
| 5,000 | ~20% relative | ~14% relative |
| 10,000 | ~14% relative | ~10% relative |
| 50,000 | ~6% relative | ~4.5% relative |
| 100,000+ | ~4% relative | ~3% relative |
Assumes 3% baseline conversion, 80% power, 95% confidence, two versions.
Step 4: Ask “would I act on this improvement?”
Say your MDE lets you detect a 15% relative improvement. Ask yourself: “If conversions went from 3.0% to 3.45%, would I actually ship the change?” If yes, your MDE is fine. If you’d ignore that improvement, raise the MDE and run a shorter test.
This catches a real trap. Some teams detect a genuine improvement but don’t act on it because the number looks small. That test was a waste of time. Pick an MDE that represents changes you’d actually ship.
What to do when your traffic is too low for a meaningful MDE
You plug your numbers into a calculator. Your page gets 2,000 visitors a month. Conversion rate is 2%. The calculator says your MDE for a 4-week test is about 35% relative.
A 35% relative improvement means going from 2.0% to 2.7%. For a button color change? Not happening. For a headline tweak? Probably not. You’d need a dramatic redesign to produce an effect that large.
So what do you do?
Adobe’s own documentation admits that “marketers under-power a remarkable number of tests.” Garret O’Connell from Bolt made the same point at Booking.com’s 2025 experimentation conference: “Too many experiments fail because of poorly chosen MDEs.”
You’ve got five real options:
1. Test bigger changes. Don’t tweak a button color. Redesign the whole section. Swap the headline, the hero image, and the call-to-action all at once. Bigger changes produce bigger effects your test can actually catch. Fastest fix on this list.
2. Pool traffic across pages. Got five similar product pages each getting 400 visitors? Run the same test across all of them. Now you have 2,000 visitors and your MDE drops fast.
3. Run a longer test. Going from 4 weeks to 8 weeks cuts your required MDE by roughly 30%. Slower, but it works. Just make sure nothing big changes mid-test (no promotions, no redesigns elsewhere).
You could also switch your statistical approach or apply variance reduction techniques like CUPED to make your existing traffic work harder. Bayesian A/B testing doesn’t give you a hard yes/no. It gives you probabilities: “78% chance Version B is better.” That’s useful even with smaller samples. Kirro uses Bayesian statistics for exactly this reason.
And if none of that works? Skip the A/B test. Under 1,000 visitors a month, qualitative research might serve you better. User interviews, session recordings, surveys. These give you direction without needing thousands of data points. You can split test your landing pages later when traffic grows.
Kirro tells you honestly when your traffic isn’t enough for reliable results. That honesty saves you from wasting weeks on tests that can’t pick a winner.
How to use a minimum detectable effect calculator
Most A/B testing software includes a built-in sample size calculator. If yours doesn’t, Evan Miller’s free calculator is the go-to. Three mistakes trip people up every time.
The inputs:
- Baseline conversion rate: your current conversion rate (check your analytics)
- Minimum detectable effect: the smallest improvement you care about (relative, usually)
- Significance level: leave this at 95% unless you have a specific reason to change it
- Statistical power: leave this at 80%
The output: the number of visitors you need per version. If you’re testing Version A against Version B, multiply by two for the total.
The most common mistake? Entering absolute MDE when the calculator expects relative. Your baseline is 5% and you type “2” meaning “2 percentage points.” The calculator reads it as “2% relative” (0.1 percentage points). Wildly wrong sample size. Always check the label.
Second one: forgetting to multiply by two. The calculator gives you visitors per version. Two versions means double the total. Testing multiple things at once with multivariate testing? Multiply by the number of versions.
And the sneaky one: using your “expected lift” as MDE. Your expected lift is what you think will happen. MDE is the smallest effect worth detecting. Different numbers. If you expect a 15% lift and set MDE at 15%, anything smaller (like a real 8% lift) slips through undetected.
As Convert.com puts it well: MDE is “the smallest lift that will be statistically significant 80% of the time.” It’s about detection probability, not a guarantee.
If you’d rather skip the calculator entirely, Kirro handles the test planning math automatically. Tell it what page you want to test and it figures out the rest.
Frequently asked questions
What does minimum detectable effect mean?
MDE is the smallest real improvement your A/B test can reliably catch. If a change to your page actually increases conversions by 5%, but your test’s MDE is 10%, you’ll probably miss it. The test will say “no clear winner” even though there was one. Think of it as a sensitivity setting. Lower MDE = more sensitive test = more visitors needed.
How do I choose the minimum detectable effect for my A/B test?
Start with your traffic and a 2-4 week test window. Work backward to find what MDE those numbers give you. Then ask: “If this improvement were real, would I act on it?” If not, you need more traffic, a longer test, or bigger changes to test. The revenue translation helps too. Convert MDE to dollars so you can see whether the detectable improvement is worth the testing time.
Does MDE affect how long my A/B test runs?
Yes, directly. Smaller MDE = longer test. If you want to detect a 5% relative improvement instead of a 10% one, you roughly need 4x the visitors. At the same traffic level, that means 4x the time. It’s a tradeoff: sharper detection requires more patience.
Is a 5% MDE good enough?
It depends on your traffic. For a page with 50,000+ monthly visitors, 5% relative MDE is achievable in 2-4 weeks. For a page with 5,000 monthly visitors, you’d need months. Match MDE to your reality, not to a benchmark. There’s no universal “good” MDE. There’s only the right MDE for your traffic, your revenue, and your test timeline.
Is 0.01 or 0.05 more significant?
These are significance levels (also called alpha). 0.05 means you accept a 5% chance of a false positive (type 1 error). 0.01 is stricter: only a 1% false positive chance. Stricter thresholds increase your MDE because you need more data to be more certain. Most A/B tests use 0.05 (95% confidence). Save 0.01 for high-stakes decisions, like changing your entire pricing structure.
What’s the difference between MDE and statistical significance?
Different questions entirely. MDE tells you the smallest effect your test can detect. Significance tells you whether the effect you did detect is real or just noise. MDE comes before the test (planning). Significance comes after (reading results). Our guide on common A/B testing mistakes covers what happens when you mix them up.

Randy Wattilete
CRO expert and founder with nearly a decade running conversion experiments for companies from early-stage startups to global brands. Built programs for Nestlé, felyx, and Storytel. Founder of Kirro (A/B testing).
View all author posts