What counts as a good conversion rate
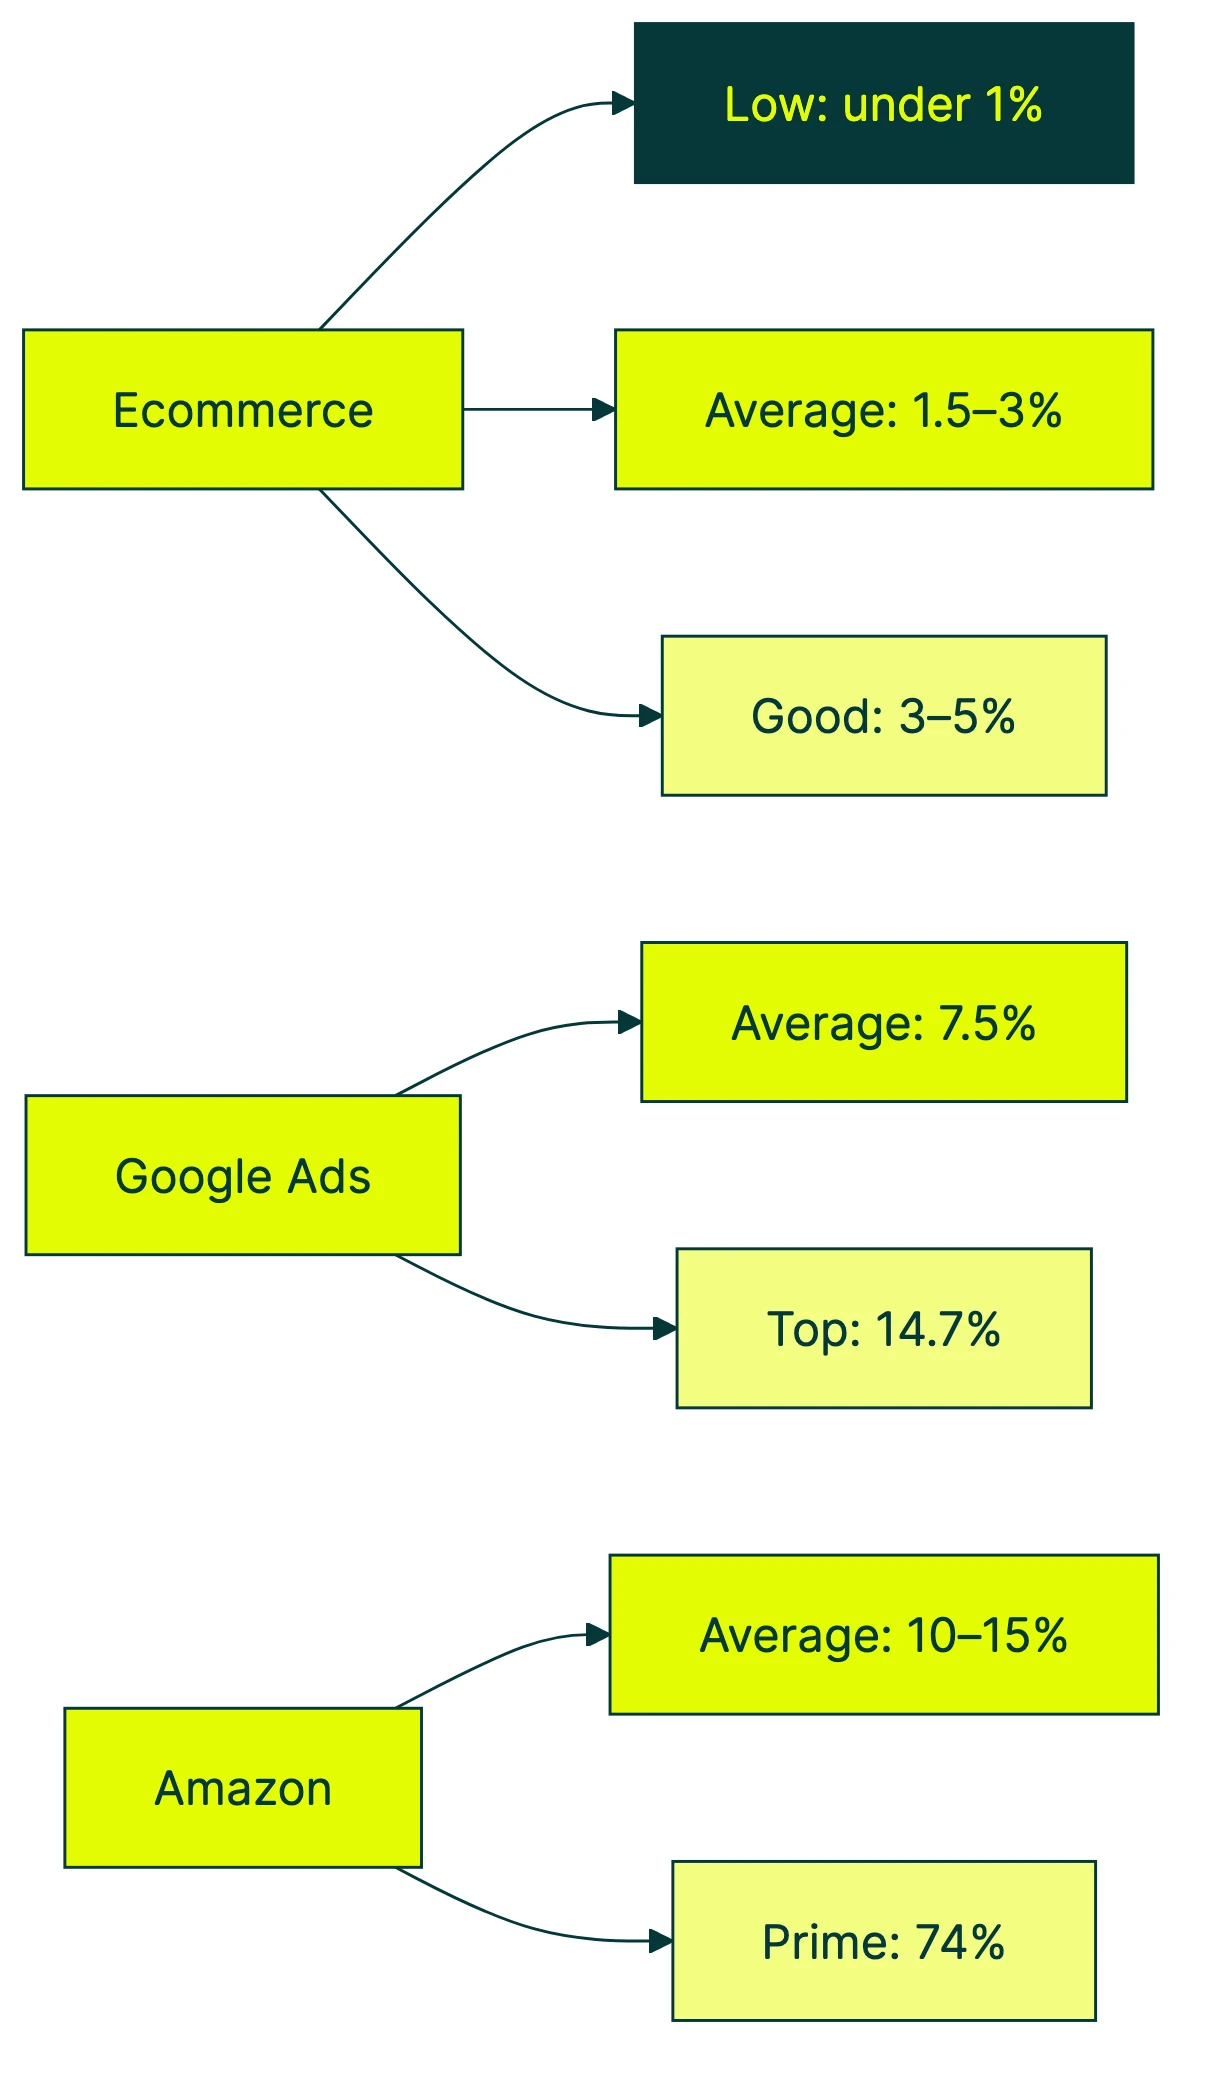
A good conversion rate is the percentage of visitors who do what you want them to do. Buy, sign up, fill out a form. For most ecommerce stores, the average sits between 1.5% and 3%. But that number hides enormous variation.
Google Ads landing pages average 7.5%. Amazon sellers see 10-15%. Shopify stores average 1.4%. A SaaS free trial page might convert at 2%, and that’s considered solid.
So “good” depends on what you’re comparing to. And most people are comparing to the wrong thing.
The honest answer: a good conversion rate is one that’s better than your own last month and makes your business money. That’s where conversion rate optimization comes in. And if you’re specifically looking at ad performance, your click conversion rate explained (conversions divided by clicks) is a different metric from the session-based rate you see in GA4. (If you keep seeing the abbreviation “CVR” in your dashboards, here’s what CVR means and why each platform calculates it differently.) Converting at 1% with fat margins and loyal customers? That might be perfectly fine. Converting at 5% but losing money on every sale? That’s a problem.
Before you chase someone else’s number, look at what the conversion rate benchmarks actually say. Where do they come from? And why can comparing yourself to an average steer you wrong?
Conversion rate benchmarks by industry
The biggest factor in what “good” looks like is what you sell. A $10 t-shirt and a $50,000 software contract are both “conversions,” but they live in completely different worlds.
Three major categories tell the story.
Ecommerce by vertical
These numbers come from Triple Whale’s 2025 benchmark study (thousands of ecommerce stores) and Dynamic Yield’s benchmarks (300 million sessions).
| Industry | Average conversion rate |
|---|---|
| Food & Beverage | 2.7-6.0% |
| Health & Beauty | 2.6-4.2% |
| Pet Care | 2.5-3.7% |
| Apparel & Fashion | 1.8-2.9% |
| Consumer Electronics | 1.3-1.7% |
| Home & Furniture | 1.3-1.7% |
| Luxury & Jewelry | 0.9% |
Notice the pattern? The cheaper and more routine the purchase, the higher the conversion rate. Nobody agonizes over a bag of dog food. A $3,000 couch gets bookmarked, discussed, slept on, and revisited four times before checkout. For checkout conversion rate benchmarks and how to improve them, we have a dedicated guide.
If you’re working on ecommerce conversion optimization, don’t panic about a 1.5% rate when you’re selling furniture. That’s normal. Our ecommerce CRO checklist has the specific fixes, and our product page optimization guide covers improving product page conversion rates element by element. And if you’re building a mobile app, the numbers look different again. Our mobile app conversion rate benchmarks break down what to expect by app category and funnel stage, and our app store conversion rate guide covers iOS and Google Play listing benchmarks specifically.
Google Ads by industry
Paid search converts higher than most channels because people are actively looking for something. WordStream’s 2025 data from 16,000 campaigns shows a cross-industry average of 7.5%, up nearly 7% year-over-year.
| Industry | Google Ads conversion rate |
|---|---|
| Automotive Repair | 14.7% |
| Animals & Pets | 13.1% |
| Real Estate | 3.3% |
| Finance & Insurance | 2.6% |
| Furniture | 2.7% |
Auto repair at 14.7% makes sense. If your car is making a weird noise, you’re not browsing. You’re buying.
B2B website conversion rates
B2B is a different game. You’re not selling a product on the spot. You’re asking someone to fill out a form, book a demo, or download a whitepaper. First Page Sage’s data across 150+ accounts shows:
| Industry | Website conversion rate |
|---|---|
| Legal Services | 7.4% |
| HVAC Services | 3.1% |
| Manufacturing | 2.2% |
| B2B SaaS | 1.1-1.5% |
If you’re in B2B, a 2% conversion rate on your website is solid. B2B conversion rate optimization is its own discipline because the buying cycle is longer and involves more people. For a deeper look at conversion rate for lead generation across each funnel stage, we break down the benchmarks separately. And for lead conversion rate benchmarks by industry, we cover the numbers from visitor-to-lead all the way through to close. For SaaS specifically, we break the numbers down further in our SaaS conversion rate benchmarks guide. If your SaaS uses a trial model, we also cover free trial conversion rates by industry separately.
And even after someone fills out your form, only about 30% of demo requests become booked meetings (Chili Piper, 4 million submissions). The conversion rate you see on your site is just the start. For form conversion rate benchmarks broken down by form type and field count, see our dedicated guide.
Our take: Industry benchmarks are useful for a sanity check. If you’re selling pet food at 0.3%, something’s wrong. But chasing the average is a trap. The average includes stores that are barely trying and stores that have spent years on conversion rate optimization. You want to know where YOU stand relative to where YOU could be.
Conversion rate benchmarks by platform
Comparing your Shopify store to Amazon is like comparing your local café to Starbucks. The platforms are built differently, and the people showing up have very different intentions.
Shopify
Littledata analyzed 2,800 Shopify stores and found:
| Shopify benchmark | Conversion rate |
|---|---|
| Average (all stores) | 1.4% |
| Top 20% | 3.2%+ |
| Top 10% | 4.7%+ |
| Mobile average | 1.2% |
| Desktop average | 1.9% |
If your Shopify store converts above 3.2%, you’re outperforming 80% of stores on the platform. Not bad.
Want to increase your Shopify conversion rate? The biggest quick win is usually enabling express checkout (Shop Pay, Apple Pay). It dramatically cuts mobile cart abandonment. For the full playbook, our Shopify conversion rate optimization guide covers everything from theme speed to checkout flow fixes.
Amazon
Amazon is a different animal entirely. The overall average sits around 10-15% for sellers, which already dwarfs standard ecommerce.
Amazon Prime members convert at 74%. That’s from a Millward Brown Digital panel study. Seventy-four percent. 22 times the US ecommerce average.
Why? Prime members have already committed. They’ve paid for the membership, stored their credit card, enabled 1-click checkout, and trust Amazon’s returns. They’re not “browsing.” They’re buying with extra steps.
Even non-Prime Amazon visitors convert at 13%, roughly 4x a typical online store.
This is why comparing your independent store’s conversion rate to Amazon’s is pointless. Amazon isn’t a store. It’s a pre-committed purchasing ecosystem. It’s like comparing your batting average to someone playing T-ball.
Etsy
Most Etsy sellers see 1-3%, with anything above 3% considered strong. Top performers hit 5%+.
Digital products (printables, templates, patterns) tend to convert highest because there’s no shipping friction. Sellers who respond to messages within 2 days see 27% higher conversion rates on average.
Landing pages
Unbounce’s 2024 report analyzed 41,000 landing pages and found a median of 6.6% across all industries. But the variation is huge: SaaS landing pages average 3.8%, while events and entertainment hit 12.3%.
One stat none of the other guides mention: email traffic to ecommerce landing pages converts at 28.6% median. That’s not a typo. When someone clicks a link in your email and lands on a page built for that offer, conversion rates go through the roof. For landing page conversion rate benchmarks broken down by industry, traffic source, and page type, we have a dedicated guide. And to see what separates average pages from top performers, check out our high-converting landing pages guide.
How traffic source and device change your rate
Most benchmark articles skip this section. It’s the one that explains why your numbers might look “bad” when they’re actually normal.
By traffic source
First Page Sage’s breakdown by channel:
| Traffic source | Typical conversion rate |
|---|---|
| Direct (typed your URL) | ~3.3% |
| 2.4-28.6% (varies wildly) | |
| Paid search | 2.0-3.2% |
| Organic search | 1.7-2.6% |
| Organic social | 0.7-0.8% |
| Paid social | 0.4-0.9% |
| Display ads | 0.3-0.7% |
If 80% of your traffic comes from Instagram, your overall conversion rate is going to look low. That’s not because your site is broken. It’s because social traffic is mostly casual browsers, not buyers. For platform-specific numbers, see our Facebook Ads conversion rates breakdown by industry. And for outbound sales channels, our cold calling conversion rate benchmarks break down the funnel from dial to close.
They weren’t searching for your product. They were scrolling past cat videos and your ad interrupted them.
Direct traffic converts 5-8x better than paid social because those people already know you. They typed your URL. They came with intent.
So before you panic about a “low” rate, check where your traffic is coming from. You can track this in GA4 and it might explain everything.
By device
Desktop still converts higher than mobile in most studies. IRP Commerce data shows desktop around 3.5-3.9% vs. mobile at 1.5-1.8%. Mobile drives more traffic but converts worse.
The gap is shrinking though. Express payment options (Apple Pay, Google Pay, Shop Pay) are a big reason. When you remove the friction of typing a credit card number on a tiny screen, mobile conversion improves fast.
Salesforce’s Shopping Index across 29 billion visits found desktop cart abandonment at 77% vs. mobile at 86%. That 9-point gap is almost entirely about checkout friction.
The readability factor (the one nobody talks about)
Unbounce’s 2024 report found something none of the top-ranking articles mention:
Pages written at a 5th-to-7th-grade reading level convert at 11.1%. Pages at an 8th-to-9th-grade level? 7.1%. Professional-level writing? 5.3%.
Simpler language converts roughly twice as well as fancy writing. The correlation between difficult words and lower conversion rates got 62% stronger between 2020 and 2024.
Reading level just means how complex your sentences and vocabulary are. A 5th-grade reading level doesn’t mean writing for kids. It means short sentences, common words, and clear structure. Writing like you talk.
You can improve your conversion rate today just by simplifying your copy. No redesign needed. No tools. Just shorter sentences and simpler words.
Our take: This tracks with everything we see in A/B testing. The version with simpler language almost always wins. People don’t read websites. They scan. And simple words scan faster.
How to calculate your own target conversion rate
Benchmarks tell you where the average sits. But the average includes stores that launched yesterday and stores that have been running CRO best practices for years. What you actually need is your own target.
The formula:
Target conversion rate = (Revenue goal ÷ Average order value) ÷ Monthly visitors
Let’s say you run a small online store:
- You want $50,000 in revenue this month
- Your average order is $100
- You get 20,000 visitors per month
That means you need 500 orders. 500 ÷ 20,000 = 2.5% target conversion rate.
Now you have a number that means something. It’s not “the industry average.” It’s what YOUR business needs to hit YOUR revenue goal.
If your current rate is 1.8%, you know you need to close a 0.7-point gap. Not sure where your rate currently stands? Use our marketing conversion rate calculator to see where you stand before you start chasing a gap. Then figure out which conversion rate metrics matter, check CTR industry benchmarks if you’re running ads, run some tests, and measure progress against a real target.
Margins matter too. If you keep 60% of each sale, a 2% conversion rate might be plenty. If your margins are razor-thin, you might need 4% just to break even after ad spend. What counts as “good” for a luxury brand looks nothing like “good” for a commodity.
Once you know your target, the next step is testing changes on your site to close the gap. Kirro makes it easy to run those tests without needing a developer or a PhD in statistics. Set up your first test and let the data tell you what works.
How to increase your conversion rate
Most “how to increase conversion rate” advice is a generic checklist. Add testimonials. Make your button bigger. Speed up your site. That stuff works, but it’s not prioritized. These tactics are ranked by impact.
1. Fix checkout friction first
This is the single biggest lever for ecommerce. Baymard Institute’s research across 50 studies shows an average cart abandonment rate of 70%. Seven out of ten people who add something to their cart leave without buying.
The top reasons: unexpected costs (48%), forced account creation (26%), and security concerns (25%).
Baymard estimates that better checkout design alone can produce a 35% increase in conversion rate for the average ecommerce site. That represents about $260 billion in recoverable revenue across the US and EU.
Translation: before you redesign your homepage, fix your checkout. Remove surprise fees. Add guest checkout. Show trust badges near the payment form.
2. Match your page to your traffic source
A visitor from Google searching “buy running shoes size 10” needs a product page. A visitor from Instagram who clicked a brand awareness ad needs a story. Send all traffic to the same page and you’ll convert poorly on at least one channel.
Build specific landing pages for your highest-traffic sources. Even a small amount of message matching (the ad says X, the page says X) makes a measurable difference.
3. Simplify your copy
We covered this above. Unbounce’s data across 464 million visitors shows simpler language converts nearly 2x better than professional-level writing. It bears repeating because it’s free to do.
Read your product descriptions out loud. If you stumble, your customers are stumbling too. Cut the jargon. Shorten the sentences. Your conversion rate will thank you.
4. Add reviews where they matter most
Research from the Spiegel Research Center at Northwestern found that reviews have an outsized impact on higher-priced products. For low-cost items, reviews help a little. For expensive items, they can be the difference between someone buying and someone leaving.
Put your best reviews near your “Add to Cart” button, not buried at the bottom of the page.
5. Test, don’t guess
All of the above are educated guesses until you measure them. A/B testing your conversion rate is how you find out which changes actually work. Tools like Kirro let you test headline changes, button text, or page layouts and see which version converts better.
Teams that run even one or two tests per month consistently outperform teams that redesign based on gut feeling. You don’t need to test everything. Start with your highest-traffic page and build a CRO strategy from there.
If you want to see which version wins, set up a free split test and let the numbers decide.
Why benchmarks can be misleading
We’ve just given you a bunch of benchmarks. Now let’s talk about why you shouldn’t obsess over them.
Revenue per visitor tells a better story
Revenue per visitor (RPV) combines your conversion rate with how much each customer spends. It’s a better metric for most businesses because it captures the full picture.
Quick example:
- Store A: 5% conversion rate, $20 average order = $1.00 per visitor
- Store B: 2% conversion rate, $80 average order = $1.60 per visitor
Store B “converts worse” but makes 60% more from each visitor. Which one would you rather run?
RPV stops you from chasing a higher conversion rate at the expense of revenue. Slashing prices will almost always boost your conversion rate. But if your profit disappears, what’s the point? You can track RPV alongside your other CRO metrics and your conversion funnel to get the full picture. For funnel-stage conversion benchmarks, we break down what “good” looks like at each step from awareness to purchase.
Expert takes on the “good rate” myth
Peep Laja, founder of CXL, puts it bluntly: “A good conversion rate is one that gets you a paying customer worth more than you spent to acquire them.” By that logic, 0.5% can be excellent. And 5% can be terrible.
Larry Kim’s WordStream analysis of $3 billion in ad spend found the median at 2.35%. But the top 10% of advertisers convert at 11.45%+. His argument: “aim for 2-5%” sets a floor, not a ceiling. The real gains come from changing your offer, not tweaking button colors.
Conversion Copy Co documented a case where a campaign raised conversion rate from 2.5% to 3.4%, but attracted deal-hunters who returned products and hurt brand loyalty. Net revenue went down. Higher rate. Less money.
What to measure instead
Track three things:
- Your conversion rate trend (are you improving month over month?)
- Revenue per visitor (are you making more money from each visit?)
- Customer lifetime value (are the customers you’re converting actually valuable?)
If all three are moving up, you’re winning. The exact percentage matters a lot less than the direction.
You can find your current numbers by checking your ecommerce conversion rate in Google Analytics, looking at your GA4 conversion rate, or drilling into your goal conversion rate in Google Analytics for individual actions like signups and form submissions.
Before diving into improvements, it helps to run a CRO audit to identify where the biggest opportunities are. And if you want a structured approach to increasing your rate, our guide on how to increase conversion rate walks through it step by step.
FAQ
What is a good conversion rate for Shopify?
The average Shopify store converts at 1.4% across all devices (Littledata, 2,800 stores). If you’re above 3.2%, you’re in the top 20%. Above 4.7% puts you in the top 10%. These numbers vary by category: food and beverage stores average 1.5%, while fashion averages 1.9%. Mobile conversion on Shopify runs lower (1.2%) because checkout friction hits harder on small screens. Enabling Shop Pay can close that gap significantly. For more, see our guide on improving your Shopify conversion rate, and for specific steps to hit a good Shopify conversion rate, we have a tactical guide.
What is a good conversion rate for ecommerce?
The global ecommerce average is 1.5-3% depending on which study you look at (IRP Commerce says 1.5%, Dynamic Yield says 2.8%, Triple Whale says 2.0%). The number moves based on your industry, price point, and traffic sources. A store selling $10 consumables should expect higher rates than one selling $500 electronics. For a deeper look, check out our guide to ecommerce CRO.
What is a good conversion rate on Etsy?
Most Etsy sellers see 1-3%. Above 3% is excellent, and top performers hit 5%+. Digital products (printables, templates) convert highest because there’s no shipping cost to scare people off. Photography quality and response time both have a measurable impact. Sellers who respond within 2 days see roughly 27% higher conversion.
What is a bad conversion rate?
Below 0.5% for ecommerce usually signals a problem: mismatched traffic (you’re paying for visitors who don’t want what you sell), UX issues (your site is confusing or slow), or pricing that doesn’t fit the audience. But context matters. Some high-ticket B2B sites convert at 0.3% and are highly profitable because each deal is worth $100,000+. “Bad” is relative to your business model, not to a universal number.
Is 5% conversion rate good?
For most ecommerce stores, 5% is excellent. It puts you in the top 10-20% of performers on most platforms. For Google Ads landing pages, 5% is actually below the 7.5% average. For Amazon, 5% would be well below average (10-15%). And for landing pages receiving email traffic, 5% is low, since the median is 28.6% in ecommerce. Always compare to the right benchmark for your specific channel and platform.
Is 30% conversion rate good?
A 30% overall site conversion rate would be extraordinary and should probably be verified. Check your analytics setup to make sure you’re tracking correctly. However, 30% is achievable for specific actions: email signup forms, targeted landing pages with warm traffic (especially email-driven), or Amazon consumable products. If you’re measuring micro-conversions (like “added to cart” rather than “completed purchase”), 30% is more realistic. Make sure you’re comparing apples to apples.
How do I calculate my conversion rate?
Divide the number of conversions by the number of visitors, then multiply by 100. If 50 people bought something out of 2,000 visitors, your conversion rate is 2.5%. You can calculate your conversion rate manually or pull it directly from Google Analytics. Just make sure you’re clear about what counts as a “conversion” for your business: a purchase, a signup, a form fill, or something else. Different conversion types will give you very different numbers, even on the same site.

Randy Wattilete
CRO expert and founder with nearly a decade running conversion experiments for companies from early-stage startups to global brands. Built programs for Nestlé, felyx, and Storytel. Founder of Kirro (A/B testing).
View all author posts