Your lead conversion rate is the percentage of leads that take the next step in your sales process. That could mean filling out a form, booking a demo, or eventually becoming a customer. The average across industries is roughly 2-5% for visitor-to-lead and 2-7% for lead-to-customer. It depends on your industry and how you define “lead” in the first place.
And that’s the problem. “Lead conversion rate” means at least five different things depending on who’s measuring it. Your marketing team says it’s 5%. Your sales team says it’s 15%. Both are right. They’re just measuring different stages of the same conversion funnel. Good conversion rate optimization starts with agreeing on which stage you’re talking about.
This guide breaks down lead conversion rate by funnel stage, industry, marketing channel, and lead source. With real conversion rate benchmarks from studies covering 100 million+ data points, not made-up numbers with no source attached.
What is lead conversion rate?
The simplest version: take the number of leads who converted, divide by total leads, multiply by 100. But “converted” is doing a lot of heavy lifting in that sentence.
Here’s why this metric confuses everyone. There are at least five places in your funnel where someone might measure “lead conversion rate”:
- Visitor to lead (someone lands on your site and fills out a form)
- Lead to MQL (a marketing-qualified lead, meaning they look like a real prospect based on their behavior)
- MQL to SQL (a sales-qualified lead, meaning sales has talked to them and agrees they’re worth pursuing)
- SQL to opportunity (sales is actively working the deal)
- Opportunity to customer (they sign the contract)
Each stage has its own conversion rate. Each one is legitimately called “lead conversion rate” by somebody. And each one produces a wildly different number.
This is why comparing your lead conversion rate to a generic benchmark is basically useless. A 5% visitor-to-lead rate and a 5% lead-to-customer rate describe completely different levels of performance. You need to know which stage you’re measuring before the number means anything.
One more distinction that trips people up: lead conversion rate is not the same as close rate. Close rate (sometimes called win rate) measures how many deals your sales team wins from their active pipeline. Lead conversion rate can refer to any stage.
The terms get used interchangeably, but they measure different things. If you’re tracking conversion rate metrics across your whole funnel, labeling each stage matters more than you’d think.
Our take: If your marketing and sales teams are arguing about the lead conversion rate, they probably agree on the math and disagree on the definition. Fix the definition first. The number will sort itself out.
How to calculate lead conversion rate
The formula works the same at every funnel stage. If you want a deeper walkthrough of how to calculate conversion rate, we cover it separately. Here’s the short version:
Lead conversion rate = (Number of conversions ÷ Total leads) × 100
Let’s run the math for each stage. Say you start with 10,000 website visitors this month:
| Stage | What you’re measuring | Example | Rate |
|---|---|---|---|
| Visitor → Lead | 10,000 visitors, 250 fill out a form | 250 ÷ 10,000 | 2.5% |
| Lead → MQL | 250 leads, 78 show buying intent | 78 ÷ 250 | 31.2% |
| MQL → SQL | 78 MQLs, 12 are accepted by sales | 12 ÷ 78 | 15.4% |
| SQL → Opportunity | 12 SQLs, 5 become active deals | 5 ÷ 12 | 41.7% |
| Opportunity → Customer | 5 opportunities, 1 signs | 1 ÷ 5 | 20% |
Same company. Same month. Five different “lead conversion rates” ranging from 2.5% to 41.7%.
That’s not a rounding error. That’s why you hear wildly different benchmarks depending on the source. You can plug your own numbers into a conversion rate calculator to find your leaks. Or track these stages in GA4 with goal conversion rate events.
Visit to lead conversion rate benchmarks
This is top-of-funnel: what percentage of website visitors become leads? Ruler Analytics analyzed over 100 million data points and found a median of 2.9% across 14 industries.
First Page Sage breaks it down by industry using data from January 2022 through August 2025:
| Industry | Visitor-to-lead rate |
|---|---|
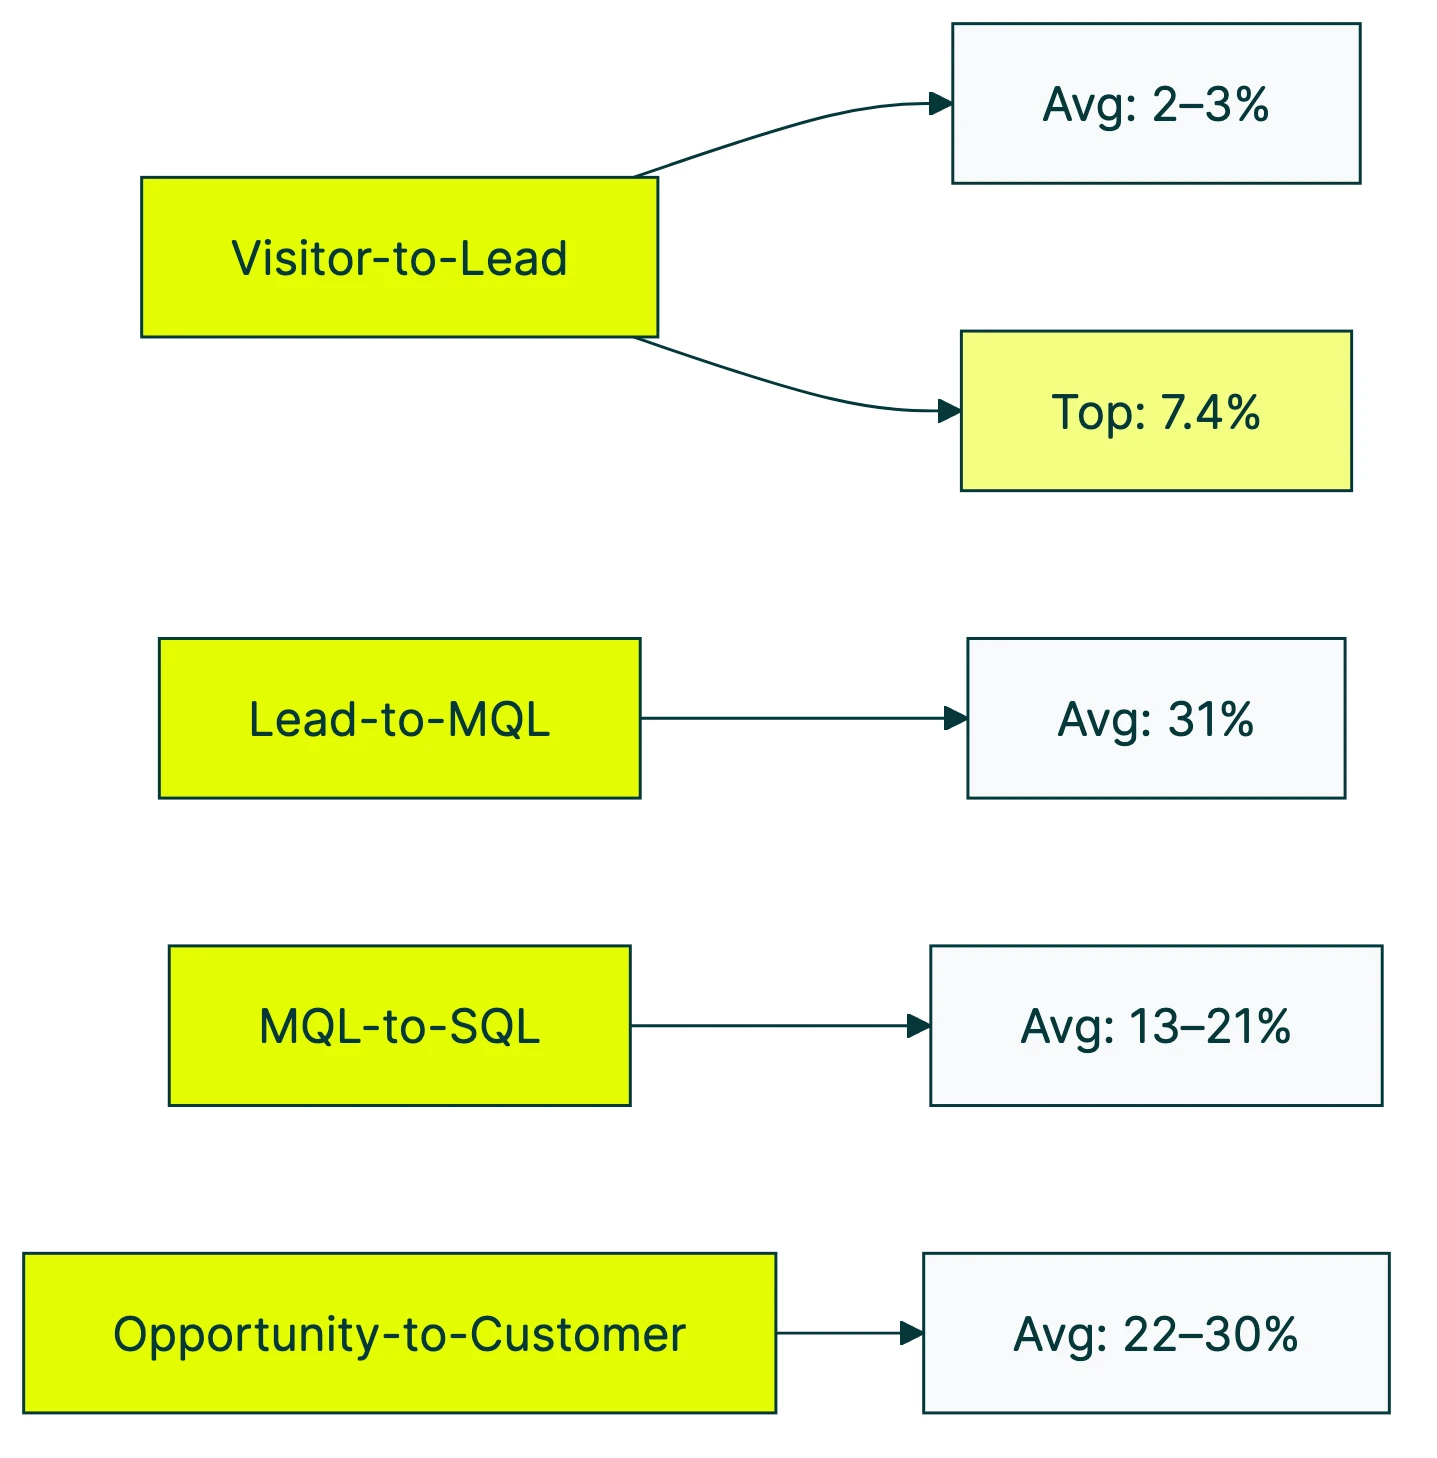
| Legal services | 7.4% |
| HVAC services | 3.1% |
| Staffing & recruiting | 2.9% |
| Higher education | 2.8% |
| Real estate | 2.7% |
| Manufacturing | 2.2% |
| Financial services | 1.9% |
| B2B SaaS | 1.1% |
| Software development | 1.1% |
Why the gap? Urgency. Someone searching for a lawyer usually has an immediate problem. Someone browsing project management software might compare tools for three months before filling out a form.
The channel you acquire visitors from matters just as much as the industry. Ruler Analytics breaks it down:
| Marketing channel | Visitor-to-lead rate |
|---|---|
| Direct | 3.3% |
| Paid search | 3.2% |
| Referral | 2.9% |
| Organic search | 2.7% |
| 2.6% | |
| Social media | 1.5% |
Social media converts at about half the rate of paid search. That doesn’t mean social is useless. It means visitors from social are earlier in their buying journey. They’re browsing, not buying. That context matters when you’re setting targets for Facebook Ads conversion rate or any paid channel. For a closer look at how ads perform before the click, our LinkedIn CTR benchmark data (and other platforms) helps set realistic expectations.
If your visitor-to-lead rate sits below your industry average, the fix usually lives on the page itself. Testing headlines, form placement, and CTA copy with Kirro can move that number. No traffic changes needed, no extra budget. Sometimes a shorter form or a clearer headline is all it takes. For SaaS-specific benchmarks, we have a separate deep dive.
Average lead conversion rate by funnel stage
Every other article gives you benchmarks for one funnel stage. Here’s what happens when you compound all five.
Here are the averages from First Page Sage (10 years of data across 29 industries) and Forrester’s Demand Waterfall research:
| Funnel stage | Average rate |
|---|---|
| Visitor → Lead | ~2.2% |
| Lead → MQL | ~31% |
| MQL → SQL | 13-21% |
| SQL → Opportunity | 30-59% |
| Opportunity → Customer | 22-30% |
Now watch what happens when you start with 10,000 visitors and run them through each stage:
- 10,000 visitors → 220 leads (2.2%)
- 220 leads → 68 MQLs (31%)
- 68 MQLs → 12 SQLs (18%)
- 12 SQLs → 5 opportunities (42%)
- 5 opportunities → 1-2 customers (25%)
Ten thousand people walk through your front door. One or two buy something. That’s a 0.01-0.02% end-to-end rate.
According to Forrester, the average lead-to-revenue conversion rate across B2B companies is 0.75%. Top performers? Just 1.54%. That’s the best in the business, and it’s still under 2%.
This math reframes the whole conversation. When someone says “our lead conversion rate is 7%,” the right follow-up question is: 7% of what, into what?
The channel your leads come from also shapes the lead-to-MQL handoff. First Page Sage data:
| Lead source | Lead-to-MQL rate |
|---|---|
| Client referrals | 56% |
| Executive events | 54% |
| SEO / organic | 41% |
| Email marketing | 38% |
| Social media | 30% |
| PPC / paid search | 29% |
| Trade shows | 24% |
| Webinars | 19% |
Referrals convert at nearly double the rate of paid search leads. Which makes sense. A warm introduction from a trusted contact carries more weight than a Google ad. But most conversion rate optimization dashboards treat every lead source equally, which hides the real story.
Our take: Your marketing budget should flow toward the channels with the highest lead-to-MQL rate, not the highest lead volume. One referral lead is worth six webinar leads, and nobody’s running that math.
Lead to customer conversion rate
This is the bottom line: what percentage of your leads eventually buy?
First Page Sage tracked lead-to-opportunity rates across 27 industries from 2019 to 2025:
| Industry | Lead-to-opportunity rate |
|---|---|
| HVAC | 11.8% |
| Pharmaceutical | 11.7% |
| Solar | 9.4% |
| Heavy equipment | 8.1% |
| Biotech | 6.9% |
| Software development | 6.6% |
| B2B SaaS | 6.2% |
| Legal services | 5.4% |
| Financial services | 5.4% |
| Real estate | 3.6% |
| IT & managed services | 3.0% |
Notice something? HVAC is at the top. Nobody shops around for three months when their office air conditioning breaks in July. Urgency compresses the sales cycle, which pushes the lead-to-customer conversion rate up.
The lead source gap is even more dramatic. Ruler Analytics data shows referral leads convert to customers at roughly 11%, while outbound leads close at about 1-2%. That’s a 5-10x difference that gets buried when you average everything together.
For SaaS products specifically, the free trial conversion rate is its own animal. And if your sales team does cold calling, those benchmarks look completely different from inbound leads. Context is everything.
What is a good lead conversion rate?
Here’s the honest answer: a “good” lead conversion rate is one that’s improving. Industry benchmarks give you a reality check, but your best comparison is your own recent performance.
That said, here are reasonable targets:
| Funnel stage | Average | Strong |
|---|---|---|
| Visitor-to-lead | 2-5% | 5%+ |
| Lead-to-MQL | 25-40% | 40%+ |
| MQL-to-SQL | 13-21% | 21%+ |
| Lead-to-customer (overall) | 2-7% | 10%+ |
Now for the contrarian take. A higher lead conversion rate isn’t always better.
Default’s 2025 B2B benchmark report found something surprising: companies with more than 25,000 monthly visitors actually converted at under 1% visitor-to-demo. Earlier-stage companies with less traffic consistently outperformed them.
More traffic doesn’t automatically mean better conversion. At scale, you attract more window shoppers, and your rate drops. That’s not a failure. It’s math.
Gartner’s research adds another wrinkle. The primary driver of low MQL-to-SQL conversion isn’t bad lead quality. It’s that marketing and sales teams use different definitions of “qualified.” Only 44% of MQLs get accepted by sales.
The metric doesn’t measure marketing performance. It measures how well your teams agree on who counts as a prospect.
Kyle Poyar at OpenView Ventures put it bluntly: MQLs are “by far the most misleading KPI in go-to-market.” His argument is that MQL definitions are set arbitrarily across companies, making cross-company benchmark comparisons essentially meaningless. You’re not comparing apples to oranges. You’re comparing apples to whatever each company decided to call an apple.
If your lead conversion rate is above your industry average and your revenue is growing, your rate is good. Full stop. If you want a broader perspective on what counts as a good conversion rate, we break that down across different contexts.
Speed to lead: the factor most companies ignore
Most lead conversion rate articles focus on definition and benchmarks. They treat it as a measurement question. But the biggest lever for improving it isn’t your website, your forms, or your targeting.
It’s how fast you pick up the phone.
The MIT/InsideSales lead response study tracked this precisely. Contacting a lead within 5 minutes makes you 100x more likely to reach them versus waiting 30 minutes. And 21x more likely to qualify them.
The Harvard Business Review published research analyzing 2.24 million sales leads. Firms that responded within one hour were 7x more likely to qualify the lead than those that waited even slightly longer.
Chili Piper’s 2025 data shows it from the booking side. When leads can schedule a meeting right after filling out a form, conversion jumps from 30% to 66.7%. More than double, just from removing the wait.
And almost nobody does it. InsideSales data shows only 0.1% of inbound leads get engaged within 5 minutes. Less than one in a thousand. Meanwhile, 57% of initial contact attempts happen more than a week after the lead came in.
The follow-up numbers are even grimmer:
- 73% of leads never get contacted at all (ZoomInfo)
- 48% of salespeople never make a single follow-up attempt
- 80% of sales happen between the 5th and 12th contact
This isn’t a knowledge gap. The speed-to-lead research has been cited for over a decade. Companies know what works. They just don’t do it.
Your lead conversion rate might be low not because your website is bad or your product is wrong. It might be low because your team takes 42 hours to respond to someone who raised their hand.
How to improve your lead conversion rate
We’re keeping this section short on purpose. For the full playbook on how to improve your lead generation conversion rate, that’s a separate guide. Here are the highest-impact moves:
1. Respond faster. Cut your lead response time to under 5 minutes. Automate meeting scheduling so leads can book immediately. This single change has more research behind it than any other tactic on this list.
2. Test your lead capture pages. Your visitor-to-lead rate lives or dies on the page. Headlines, form length, button copy, page layout. If you’re starting from scratch, our guide to building a lead generation landing page covers the five elements that matter most. A/B testing these elements takes minutes to set up and can move your conversion rate by 20-50% without changing your traffic.
3. Qualify leads before passing to sales. Gartner research shows that 56% of MQLs that reach sales aren’t actually a fit. Better qualification criteria mean fewer wasted sales calls and higher SQL conversion rates. A 2025 study in Frontiers in AI found that ML-based lead scoring doubled conversion rates from 8% to 17%.
4. Track each funnel stage separately. One “lead conversion rate” number hides everything. Break it into visitor-to-lead, lead-to-MQL, MQL-to-SQL, and opportunity-to-customer. The stage with the worst rate is where your biggest improvement lives. Understanding what CRO is and applying it to each stage gives you a framework for B2B conversion rate optimization.
If you want to test whether a simpler form or a different headline improves your visitor-to-lead rate, Kirro lets you set up a free split test in minutes. Sometimes one less form field is the whole fix.
FAQ
What is lead conversion rate?
Lead conversion rate is the percentage of leads that move from one stage of your sales funnel to the next. The formula is (leads who converted ÷ total leads) × 100. The exact definition depends on which stage you’re measuring. Visitor-to-lead, lead-to-MQL (a marketing-qualified lead), MQL-to-SQL (a sales-qualified lead), or lead-to-customer all produce different rates from the same data.
What is a good lead conversion rate?
For visitor-to-lead: 2-5% is average, 5%+ is strong. For lead-to-customer: 2-7% is average, 10%+ is strong. But the right target depends on your industry, lead source, and sales cycle length. Legal services convert visitors at 7.4%, while software companies sit near 1.1%. Your best benchmark is your own performance last quarter.
How do you calculate lead conversion rate?
Divide the number of leads who converted by the total number of leads, then multiply by 100. For example: 50 form fills from 2,000 website visitors = a 2.5% visitor-to-lead conversion rate. The formula stays the same at every funnel stage. What changes is the numerator (who “converted”) and the denominator (which leads you’re counting).
What is lead conversion ratio?
Same thing as lead conversion rate. “Ratio” and “rate” are used interchangeably across the industry. Both measure the proportion of leads that advance through your funnel. Some analytics platforms use “ratio,” while most marketing teams say “rate.” The math is identical.
What’s a good conversion rate for a lead magnet?
Lead magnet opt-in rates (the percentage of visitors who download your ebook, checklist, or report in exchange for their email) typically range from 1-5% for pop-ups and 10-25% for dedicated landing pages. For landing page conversion benchmarks broken down by industry and traffic source, we have a dedicated guide. The key driver is specificity. A generic “download our ebook” converts worse than a targeted “get the 2026 SaaS benchmark report.” The more specific the promise, the higher the click conversion rate.

Randy Wattilete
CRO expert and founder with nearly a decade running conversion experiments for companies from early-stage startups to global brands. Built programs for Nestlé, felyx, and Storytel. Founder of Kirro (A/B testing).
View all author posts