A conversion rate calculator for marketing takes your visitors and conversions, then tells you the percentage. Simple math: (conversions ÷ visitors) × 100. If 10,000 people visit your site and 250 buy something, your conversion rate is 2.5%.
Most calculators stop there. They skip what that number actually means for your revenue. And without that context, conversion rate optimization stays abstract.
A 2.5% rate isn’t “good” or “bad” on its own. It’s a starting point. The real question is what happens to your bank account if you move it to 3%.
That’s why we built a conversion rate calculator with a “what if” revenue mode. Plug in your numbers, adjust the rate, and see the dollar difference. No guesswork. No spreadsheet gymnastics.
Marketing conversion rate calculator
The formula is straightforward:
Marketing conversion rate = (conversions ÷ total visitors) × 100
What counts as a “conversion” depends on what you’re measuring. For an ecommerce store, it’s purchases. For a SaaS company, it’s signups or free trial starts. For a lead gen site, it’s form fills. The math is the same. The definition changes.
Here’s a quick example. You run a Shopify store. Last month: 15,000 sessions, 375 orders. Your marketing conversion rate calculator math: 375 ÷ 15,000 × 100 = 2.5%.
That 2.5% tells you one thing: out of every 100 visitors, roughly 2 or 3 took action. But is that good? That depends on your channel, your industry, and what you’re selling. A good conversion rate for Google Ads looks nothing like a good rate for organic blog traffic.
One detail that trips people up: “visitors” can mean different things. Google Ads counts clicks. GA4 counts sessions. Your email tool counts recipients. Same 100 conversions, three different denominators, three different “conversion rates.” More on that below.
Our take: Most marketing conversion rate calculators stop at the percentage. That’s like checking the weather without deciding what to wear. The number only matters if you do something with it.
Sales conversion rate calculator
A conversion rate calculator for sales swaps “visitors” for “leads” and “conversions” for “closed deals.”
Sales conversion rate = (closed deals ÷ total leads) × 100
If your sales team works 500 leads in a month and closes 25 deals, your sales conversion rate is 5%. That’s a decent number for B2B. First Page Sage’s data across 30 industries shows the average lead-to-customer rate sits between 2% and 5%.
But “lead” is a slippery word. A raw inquiry from a web form is not the same as a sales-qualified lead your rep already vetted. Those two starting points produce wildly different rates. If you’re comparing your numbers to benchmarks, make sure you’re measuring the same thing.
The sales conversion funnel has multiple stages, each with its own rate. Your funnel analytics should track every transition. Lead to marketing-qualified lead (someone who matches your target profile): roughly 31% on average.
MQL to sales-qualified lead (someone your rep agrees is worth pursuing): 32% to 58% depending on industry. SQL to closed deal: 37% to 66%.
For a deeper breakdown of each stage, see our guide on conversion rate for lead generation. This post sticks to the top-level calculation.
How the “what if” revenue mode works
No other conversion rate marketing calculator shows you this part. Which is weird, because it’s the part that actually matters.
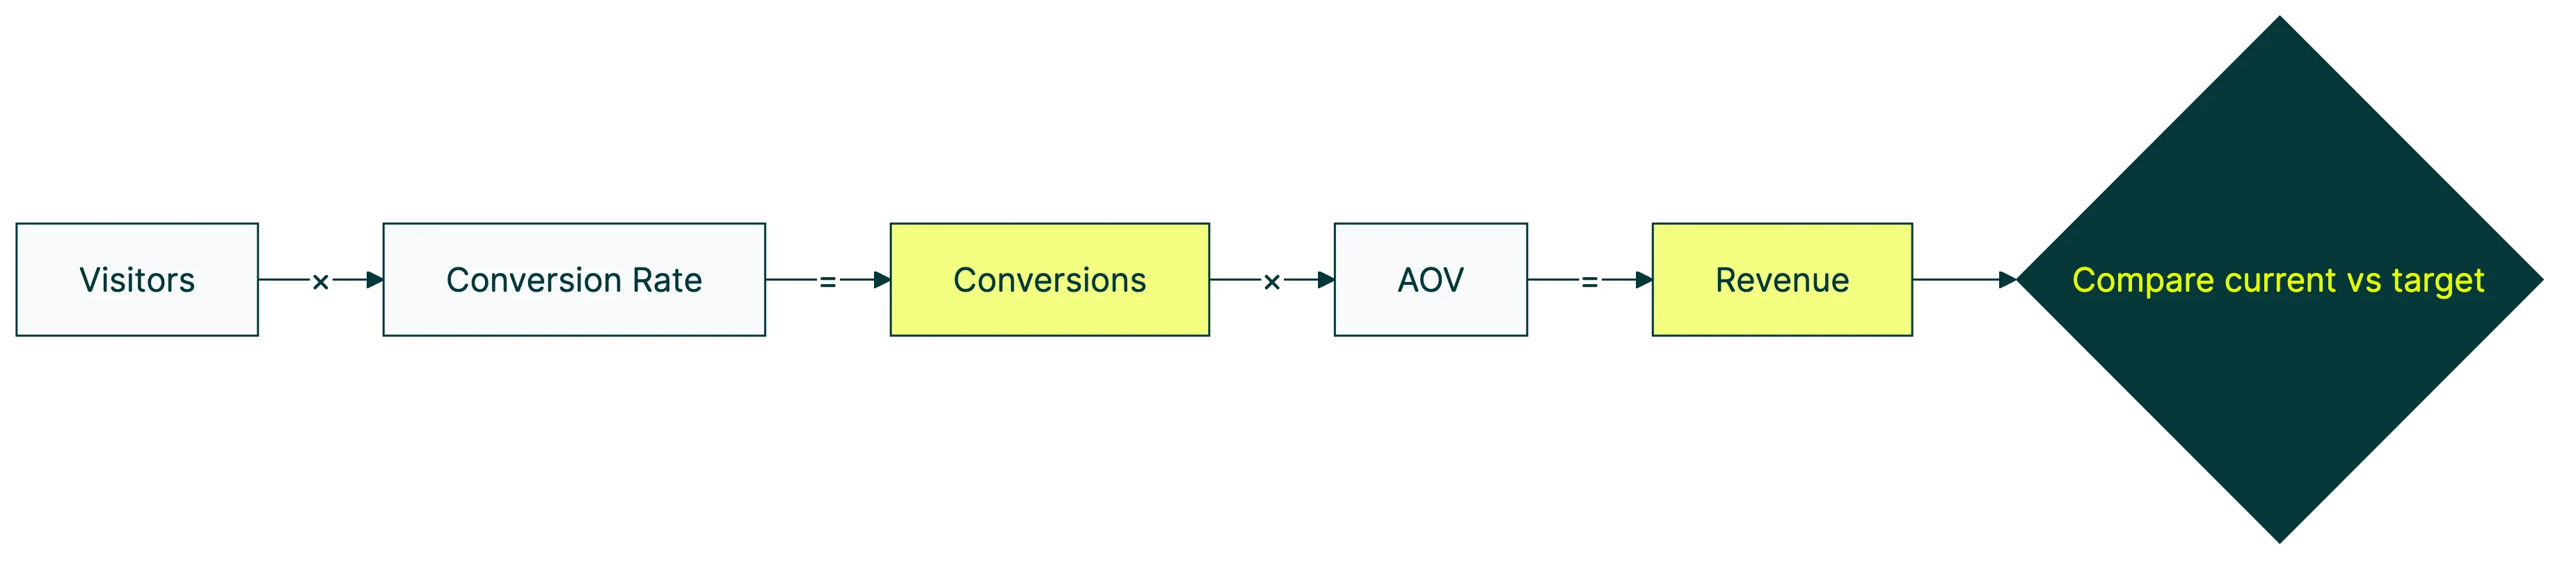
Here’s how it works. You enter four numbers:
- Monthly visitors: 50,000
- Current conversion rate: 2.5%
- Revenue per conversion: $50 average order value
- Target conversion rate: 3.0%
The math:
| Metric | Current (2.5%) | Target (3.0%) | Difference |
|---|---|---|---|
| Monthly conversions | 1,250 | 1,500 | +250 |
| Monthly revenue | $62,500 | $75,000 | +$12,500 |
| Annual revenue | $750,000 | $900,000 | +$150,000 |
A half-percent lift. $150,000 per year in additional revenue. Same traffic. Same ad spend. Same product.
That’s the power of the “what if” framing. Percentages feel abstract. Dollars feel real.
It gets better if you improve rates across multiple funnel stages. The gains compound. A 10% improvement at three stages doesn’t give you 30% more revenue. It gives you 33.1%. The math: 1.1 × 1.1 × 1.1 = 1.331.
Nonprofit optimization firm NextAfter calls this “win-stacking”. It’s real.
That $150,000 projection? It’s the conservative scenario. If you also improve your landing pages and tighten your checkout flow, the gains stack on top of each other.
This is the moment where calculators turn into decisions. You can test this on your own site in about three minutes and start finding those half-percent lifts.
Average conversion rates by channel
Before you panic (or celebrate), compare your number to the right benchmark. Different channels, different expectations.
| Channel | Average conversion rate | Source |
|---|---|---|
| Google Ads (all industries) | 7.52% | WordStream 2025 |
| Landing pages (median) | 6.6% | Unbounce 2024 |
| Ecommerce (global) | 1.51–1.65% | IRP Commerce 2025-2026 |
| Email abandoned cart flows | 10.7% | Klaviyo 2025 |
| Email broadcast campaigns | 0.05% | Klaviyo 2025 |
| B2B lead-to-customer | 2–5% | First Page Sage |
| Food & beverage ecommerce | 6.0% | Dynamic Yield |
| Luxury ecommerce | 0.9% | Dynamic Yield |
Look at the gap between food & beverage (6.0%) and luxury (0.9%). Same formula, same calculator, completely different expectations. A luxury jewelry brand converting at 2% is crushing it. A food subscription box at 2% has room to grow.
One stat worth absorbing: the top 10% of Google Ads advertisers convert at 11.45% or higher. That’s 3 to 5 times the median.
They’re not doing 3 to 5 times more work. They’re testing their headlines, offers, and landing pages instead of guessing. The gap between average and great is usually one or two well-tested changes.
For a full breakdown by industry, see our complete guide to good conversion rates. And if you’re tracking this in Google Analytics, here’s how to find your ecommerce conversion rate in GA.
Our take: Comparing your rate to an industry average is fine as a gut check. But the benchmark that matters most is your own number from last month. Are you improving? That’s the real question.
When your conversion rate number is misleading
A conversion rate calculator gives you a number. But that number isn’t always telling the truth. Here’s when to be skeptical.
The denominator problem
This trips up more people than any other part of the formula. Different platforms use different denominators for the exact same metric:
- Google Ads: conversions ÷ clicks
- GA4: conversions ÷ sessions (they call it session key event rate)
- Email platforms: conversions ÷ recipients
- Sales CRMs: deals ÷ leads
Same 100 conversions. Wildly different rates:
| Denominator | Count | Conversion rate |
|---|---|---|
| Ad clicks | 2,000 | 5.0% |
| Sessions | 3,500 | 2.86% |
| Unique visitors | 1,500 | 6.67% |
That’s the same business, same month, same conversions. Three different “conversion rates.” When someone asks “what’s your conversion rate?” the honest answer is “which one?”
When you’re comparing your numbers to benchmarks, make sure you’re using the same denominator. A click conversion rate is not the same as a session-based rate. Mixing them up leads to bad decisions.
The traffic quality trap
Here’s a scenario. You run a Facebook campaign that brings in 142% more sessions. Orders go up 55%. Sounds great, right?
But your conversion rate drops 36%. New visitors from paid social convert at 1.6%, while your organic regulars convert at 4.2%.
The blended rate falls because you added a ton of low-intent traffic. The dip is a math trick, not a failure.
A trend shows up in your combined data but disappears when you look at each group separately. Statisticians call this Simpson’s Paradox. Optimizely actually built a tool to correct for it in A/B tests.
The takeaway: if your traffic sources changed, your conversion rate change might mean nothing.
The small sample trap
A 10% conversion rate from 20 visitors is not data. It’s a coin flip.
Peep Laja, founder of CXL, recommends 3,000 to 4,000 conversions per variation before trusting a test result. Not a typo. Thousands of conversions, not hundreds of visitors.
If you plug 20 visitors into a conversion rate calculator and get 10%, don’t build your strategy around it. Wait until you have real volume.
The seasonality trap
TurboTax’s website goes from roughly 8% conversion in November to 45% in April. No page changes. No redesign. Just tax season.
If your business has seasonal patterns, comparing January to July is comparing apples to tax returns. Always compare the same period year-over-year.
How to actually improve your conversion rate
You’ve run the numbers. Now you want to move them. Here are the changes backed by the strongest data.
Start with your copy. Unbounce analyzed 41,000 landing pages and found something interesting. Pages written at a 5th to 7th grade reading level convert at 11.1%. Professional-level writing? 5.3%. More than double the conversions from simpler words, and the gap has grown 62% since 2020.
Then look at your checkout. The average one has 5.1 steps and 11.3 form elements. Baymard Institute estimates that better checkout design alone can improve conversions by 35.26%. That’s $260 billion in recoverable revenue across US and EU ecommerce.
Before you touch either of those, though, test your value proposition. It has 3x more impact than reducing friction. We covered the full framework in our guide on how to optimize conversion rate.
Automated email flows are another quick win. Abandoned cart emails convert at 10.7%, compared to 0.05% for broadcast campaigns. A 213x difference. If you’re not running automated flows, you’re leaving money on the floor.
One thing to avoid: slashing prices to boost your rate. Splitbase documented a case with Dr. Squatch where the brand skipped discounting entirely. They added a quantity selector to their product page instead.
Result: $800,000+ in extra monthly revenue without changing the conversion rate at all. Sometimes average order value matters more than conversion rate.
If you want a structured process, our CRO best practices guide walks through each step. And to see the full impact of changes, set up a free split test and let the numbers decide which version wins.
Conversion rate vs revenue per visitor
Peep Laja, founder of CXL, puts it bluntly. Conversion rate is “definitely not a final godly metric.”
His reasoning is simple. Cut your prices in half. Your conversion rate will jump. Your revenue will tank. The metric went up while the business got worse.
That’s why many practitioners prefer revenue per visitor (total revenue ÷ total visitors) or profit per visitor. These metrics account for what actually matters: money.
So when should you use conversion rate?
- Comparing two page versions in an A/B test. Version A at 3.2% vs Version B at 4.1% is a clear signal.
- Tracking channel quality. If your Google Ads convert at 5% and your Facebook ads convert at 1.2%, that tells you something useful.
- Diagnosing funnel leaks. A sharp drop between steps points to a friction problem. Goal conversion rates help you find exactly where people bail.
And when should you NOT rely on conversion rate alone?
- Comparing across industries. A 2% rate in luxury ecommerce and a 2% rate in SaaS mean very different things.
- After changing your traffic mix. New channels bring new audiences with different intent.
- As your only success metric. Conversion rate is one of several important CRO metrics. Revenue, profit, and customer lifetime value complete the picture.
A/B testing tools like Kirro show you both conversion rate and revenue impact side by side. Because a winning test that lifts conversions but drops revenue isn’t actually winning.
FAQ
How do you calculate conversion rate in marketing?
Divide your conversions by total visitors, then multiply by 100. That’s it. If 10,000 people visit your landing page and 300 fill out a form, your conversion rate is 3%.
The tricky part is which “visitor” number to use. In GA4, your conversion rate shows up as “session key event rate.” In Google Ads, it’s conversions divided by clicks. The formulas look the same, but the denominators are different and produce different numbers. For a full walkthrough, see our guide on how to calculate conversion rate.
What is a good conversion rate for marketing?
It depends on the channel. Google Ads averages 7.52% across all industries in 2025. Landing pages sit around 6.6% median. Ecommerce websites average 1.5 to 1.7% globally.
The top 10% of advertisers hit 11.45% or higher. That’s 3 to 5x the average. So “good” really means “better than your own last month.” Check our full breakdown of conversion rate benchmarks for industry-specific numbers.
What is CTR and CVR?
CTR (click-through rate) measures how many people clicked your ad or link. The formula: clicks ÷ impressions (the number of times your ad was shown) × 100.
CVR (conversion rate) measures how many of those clicks turned into actions. The formula: conversions ÷ clicks × 100.
High CTR plus low CVR means your ad grabs attention but your landing page doesn’t close the deal. That’s a landing page problem, not an ad problem. For more on this relationship, see our post on click conversion rate.
How do you calculate sales conversion rate?
Divide closed deals by total leads, then multiply by 100. If your team works 400 leads and closes 20 deals, your sales conversion rate is 5%.
The B2B average sits between 2% and 5% for lead-to-customer, depending on industry and how you define “lead.” Raw form submissions convert at a lower rate than sales-qualified leads your reps have already vetted. For stage-by-stage benchmarks, see our guide on conversion rate for lead generation.
What is a conversion rate calculator used for?
Three things. First, calculating your current rate so you can benchmark against industry averages. Second, modeling the revenue impact of improving your rate. A 0.5% lift on 50,000 monthly visitors at $50 average order value equals $12,500 per month in additional revenue. Third, comparing two versions of a page in an A/B test to see which performed better.
Tools like Kirro handle that third use case automatically. You set up two versions, send traffic to both, and Kirro tells you which one won with the math already done for you. No calculator needed.

Randy Wattilete
CRO expert and founder with nearly a decade running conversion experiments for companies from early-stage startups to global brands. Built programs for Nestlé, felyx, and Storytel. Founder of Kirro (A/B testing).
View all author posts