Conversion rate = (conversions ÷ total visitors) × 100. If 2,000 people visit your site and 50 buy something, your conversion rate is 2.5%.
That’s the formula. You could stop reading here and be fine for most situations.
The formula is the easy part. The hard part is deciding what counts as a “conversion,” whether to divide by sessions or people, and why two analytics tools show you different numbers for the same website. That’s what this guide is actually about. It’s one of the first steps in conversion rate optimization and understanding your funnel analytics.
The conversion rate formula
Nielsen Norman Group defines conversion rate as “the percentage of visitors who take a desired action.” That desired action could be a purchase, a signup, a form submission, or anything else you care about.
Here’s how it works with real numbers:
- 500 orders from 20,000 visitors = 2.5% conversion rate
- 120 signups from 3,000 visitors = 4% conversion rate
- 45 form submissions from 1,800 visitors = 2.5% conversion rate
Simple enough. But notice how I said “visitors” without defining what that means. GA4 (Google’s analytics tool) gives you two different answers depending on whether you count visits or individual people. More on that in a minute.
If you want to skip the math entirely, a conversion rate calculator can do the division for you. But understanding the formula yourself matters, because calculators can’t tell you when your inputs are wrong. And if you’re seeing the abbreviation “CVR” in your ad dashboards, that’s just shorthand for CVR conversion rate . Same formula, but each platform plugs in different numbers.
How to calculate conversion rate step by step
The formula is one line. Getting your inputs right takes a bit more thought.
Step 1: Define what counts as a “conversion.”
This sounds obvious, but it’s the step most people skip. A conversion is whatever action matters most to your business right now. For an online store, that’s a completed purchase. For a SaaS company, it’s a free trial signup.
Pick one. Write it down. Don’t change it mid-measurement, or your numbers won’t mean anything.
Step 2: Pick your time period.
Monthly is the most common. Weekly works if you’re running a short promotion. Daily is usually too noisy to be useful (one slow Tuesday can make your whole week look bad).
Step 3: Choose your denominator.
This is where people silently make different choices and then wonder why their numbers don’t match anyone else’s. You’re dividing by either sessions (total visits, including repeat visits from the same person) or unique visitors (individual people). Both are legitimate. I’ll cover which one to use below.
Step 4: Pull your numbers.
Open GA4, Shopify analytics, or whatever tool you use. Find your conversion count and your visitor count for the same time period.
Step 5: Apply the formula.
Conversions ÷ visitors × 100. Done.
Here are three worked examples to make it concrete:
Ecommerce: Your Shopify store had 12,000 sessions last month and 180 orders. That’s 180 ÷ 12,000 × 100 = 1.5% conversion rate.
SaaS: Your landing page got 5,000 visitors and 200 signed up for a free trial. That’s 200 ÷ 5,000 × 100 = 4% conversion rate. (To see how that stacks up, check our guide on how to calculate landing page conversion rate with industry benchmarks.)
Lead gen: Your contact page had 800 visitors and 32 filled out the form. That’s 32 ÷ 800 × 100 = 4% conversion rate.
Our take: Step 1 matters more than the math. We’ve seen teams argue about whether their conversion rate is “good” when they haven’t even agreed on what they’re measuring. Define the conversion first. Everything else follows.
Conversion rate calculation by business type
The basic formula stays the same. What changes is what you plug into it.
Ecommerce: orders ÷ sessions × 100. Most online stores use sessions (total visits) as the denominator because that’s what Shopify and GA4 default to. According to Littledata, the average Shopify store converts at 1.4%. The top 20% hit 3.2% or higher.
If you’re at 1.4%, you’re average. Not bad, not great. But the top stores aren’t doing magic. They’re usually just testing their headlines, product pages, and checkout flow more often. You can test this on your own site in about three minutes and see what moves the number.
SaaS: signups ÷ website visitors × 100. SaaS companies often care about a second conversion rate too: trial-to-paid. Getting people to sign up is step one. Getting them to pay is step two.
A SaaS product with a 5% visitor-to-trial rate and a 25% trial-to-paid rate has an effective purchase conversion rate of 1.25%. Track both stages separately. They measure different problems. For industry benchmarks for SaaS at each funnel stage, we’ve compiled the data separately.
Lead generation: form submissions ÷ landing page visitors × 100. Your form conversion rate depends heavily on form type, field count, and industry. Lead gen gets more complicated because you have multiple conversion funnel stages. Visitor to lead. Lead to qualified lead (marketing teams call these MQLs). Qualified lead to customer.
Each stage has its own conversion rate, and each one matters. Check out our breakdown of lead generation conversion rates for benchmarks by channel, and our cold call conversion rate guide for outbound sales funnel math.
Content and media: goal completions ÷ visitors × 100. Newsletter signups, PDF downloads, video completions. These are your conversions when you’re not selling directly. A blog post that gets 10,000 readers and 200 email signups has a 2% conversion rate. Not glamorous, but those 200 people opted in. They’re worth more than 10,000 strangers.
WordStream puts the average landing page conversion rate at 2.35%, with the top 25% hitting 5.31% or higher. But those numbers blur together ecommerce, SaaS, and lead gen. Your rate depends on your business type, and comparing across types is like comparing your golf score to someone’s bowling score.
Wondering if your number is any good? We wrote a whole guide on what counts as a good conversion rate by industry.
Sessions vs users: which number goes on the bottom?
GA4 gives you two metrics: “session key event rate” and “user key event rate.” Google’s own documentation treats them as equally valid. They can tell very different stories.
Here’s a quick example. One person visits your site 5 times over a month. On the fifth visit, they buy something. Your session conversion rate is 20% (1 purchase ÷ 5 sessions). Your user conversion rate is 100% (1 purchase ÷ 1 person). Same customer, same purchase, wildly different percentages.
Scale that up across thousands of visitors and the gap gets real.
| Sessions | Users | |
|---|---|---|
| Best for | Ecommerce, short purchase cycles | B2B, expensive or high-consideration purchases |
| Why | One visit = one decision. Clear story. | Buyers research for weeks. Session rates look artificially low. |
| Benchmarks | Most published benchmarks use sessions | Less common in benchmarks |
| Downside | Repeat visits dilute the rate | Cross-device tracking is unreliable |
The experts disagree on this. Avinash Kaushik, who helped build Google Analytics, recommends unique visitors. Conversionista recommends sessions because tracking people across devices is unreliable.
Someone who visits on their phone and buys on their laptop looks like two different “users” to most analytics tools. That’s a real problem.
Jakob Nielsen from NN/g cuts through it: “Either approach works if applied consistently across all measurement periods.”
He’s right. The worst thing you can do is switch back and forth. Pick one and stick with it.
For a visual walkthrough of these concepts inside GA4, MeasureSchool covers how session and user key event rates work:
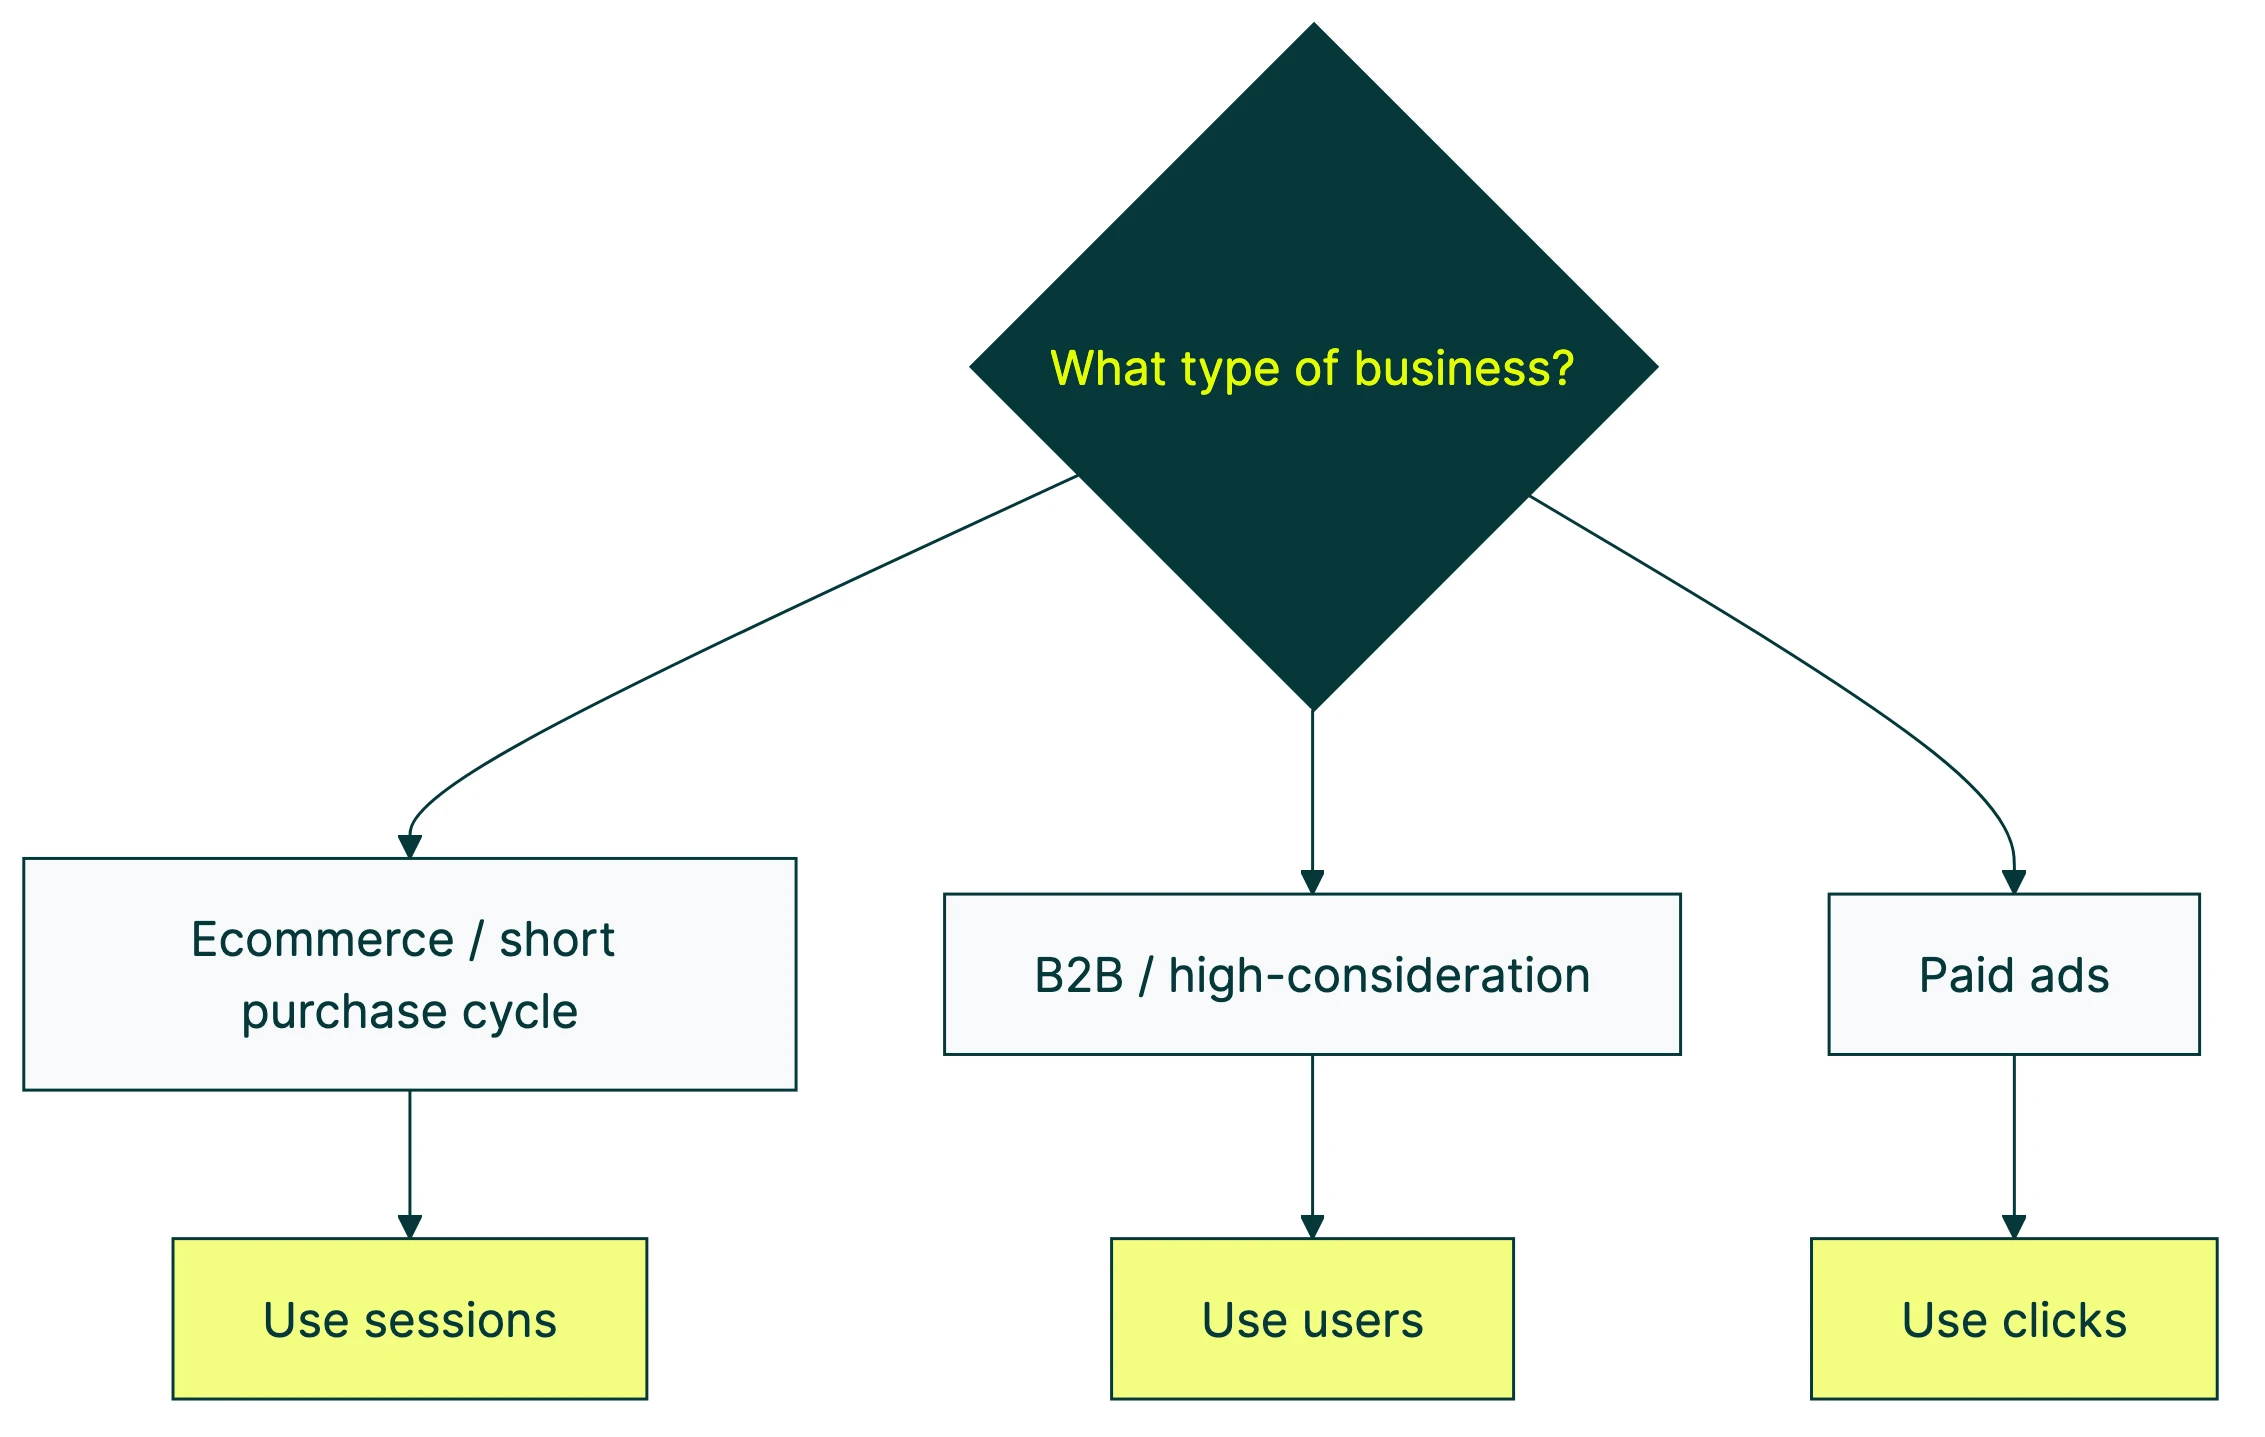
Our take: Use sessions for ecommerce. Use users for B2B and SaaS. And whatever you pick, write it down so future-you doesn’t wonder why last quarter’s numbers look so different.
Micro vs macro conversions
A macro conversion is the thing you actually want: a purchase, a signup, a contract signed. A micro conversion is a step along the way: adding something to the cart, clicking “pricing,” watching a demo video, scrolling to the bottom of a page.
Both are worth measuring. But never compare them to each other.
This matters because benchmark numbers often mix the two. Unbounce counts form submissions and button clicks. Littledata counts completed purchases. That’s why you’ll see one source say “average conversion rate is 6.6%” and another say “1.4%.” They’re measuring different things.
The gap between micro and macro can be enormous. Baymard Institute found that the average cart abandonment rate is 70.22% across 50 studies. That means for every 10 people who add something to their cart (micro conversion), only about 3 actually buy (macro conversion).
Track both types, but report macro conversions to your boss or clients. “Add to cart went up 15%” sounds nice, but “purchases went up 8%” is what actually pays the bills.
If you’re tracking click conversion rates specifically, keep those separate from your purchase conversion rate. Mixing them together creates a number that doesn’t mean anything useful.
Three mistakes that make your conversion rate misleading
The formula is easy. Interpreting the result is where people get into trouble.
Mistake 1: Ignoring traffic source mix
Your overall conversion rate can move in the opposite direction of reality when your traffic mix changes. Statisticians call this Simpson’s Paradox, but you don’t need to know the name. You just need to see how it works.
Say you run an online store. In January, 80% of your traffic comes from Google search (converts at 3%) and 20% from social media (converts at 1%). Your blended rate: 2.6%.
In February, a viral TikTok sends a wave of social traffic. Now it’s 50% search (still converting at 3%) and 50% social (still converting at 1%). Your blended rate drops to 2.0%.
Your conversion rate “fell,” but nothing actually got worse. Both channels are converting at exactly the same rate. The mix just shifted. Mixpanel documented real cases where aggregate numbers told the exact opposite story from segmented data.
The fix? Always segment by traffic source before drawing conclusions. Your overall number is a blend, not a fact.
Mistake 2: Treating higher conversion rate as always better
A higher conversion rate isn’t always a win.
IRP Commerce tracked ecommerce data across thousands of stores. In January 2026, the average conversion rate fell 5.64% year over year. Revenue per session rose 14.07% over the same period.
What happened? Average order values went up. Fewer people converted, but the people who did were spending more. The stores were actually doing better, even though the conversion rate “got worse.”
This is why Smart Insights argues that conversion rate on its own is “a horrible metric to focus on.” The number that actually matters is revenue per visitor (conversion rate × average order value). A 2% conversion rate with a $100 average order beats a 4% rate with a $30 average order. Every time.
Check your key CRO metrics together, not in isolation. Conversion rate is one piece of the puzzle, not the whole picture.
Mistake 3: Comparing your rate to irrelevant benchmarks
“The average conversion rate is 2.35%.” You’ve seen that number everywhere. But whose average? Which industry? Which traffic source? Which definition of conversion?
Unbounce’s benchmark report found that email traffic converts at 19.3%. Cold traffic from paid ads? Way lower. If your competitor gets 60% of traffic from email and you get 60% from paid search, their “higher conversion rate” doesn’t mean their site is better. They just have warmer traffic.
Your rate depends on: traffic source, industry, product price, and how you define “conversion.” Comparing without controlling for all four is meaningless.
Compare to your own past performance first. That’s the only benchmark that actually tells you if you’re getting better.
How to track conversion rate in practice
You don’t need fancy software to calculate conversion rate. But you do need consistency.
Google Analytics 4: Go to Reports, then Engagement, then Key Events. You’ll see session key event rate and user key event rate. Pick one (see the sessions vs users section above).
Quick heads up: GA4 renamed “conversions” to “key events” in March 2024. Same thing, new name. For a deeper walkthrough, check our guide on tracking conversion rate in GA4.
Shopify: Go to Analytics, then Reports, then “Sessions converted.” Shopify uses sessions by default. If you need more detail, our ecommerce conversion tracking in Google Analytics guide walks through the setup.
Or just use a spreadsheet. Seriously. A Google Sheet with columns for month, visitors, conversions, and conversion rate works fine for small businesses. Update it monthly. Done.
When you’re running A/B tests, tools like Kirro calculate conversion rate automatically for each version of your page. They also add confidence intervals (a range that tells you how sure you should be about the result), so you’re not comparing two raw percentages and guessing which one is real.
The most common mistake we see isn’t bad math. It’s comparing test results across different time periods or traffic sources. The tool handles the calculation. You handle making sure the comparison is fair.
What to do after you calculate your rate
You’ve got your number. Now what?
Compare to yourself first. Was your conversion rate higher or lower than last month? Last quarter? The trend matters more than any benchmark. Once you know your numbers, check them against funnel conversion rate benchmarks by stage to see where you stand relative to your industry.
Then segment before you react. Your mobile conversion rate and desktop conversion rate are probably very different. Same for paid traffic vs organic. Analyze where visitors drop off in your funnel before making changes.
Find the biggest drop-off. If 80% of visitors leave your landing page without scrolling, your headline is the problem. If they scroll but don’t click the button, your CTA (the button or link you want them to click) needs work. If they click but don’t complete checkout, your conversion funnel has a leak further down.
Fix the biggest leak first. A 70% drop-off beats tweaking a 5% one every time.
Test changes instead of guessing. You could spend weeks debating whether a green button or blue button converts better. Or you could set up a free split test and know the answer in a few days. When we test headline changes for clients, we regularly see 10-20% lifts. Small changes, real results.
Start with the page that gets the most traffic and the lowest conversion rate. That’s where the biggest opportunity is. Then A/B test to improve your conversion rate on that page before moving to others.
If you want a more structured approach, our guides on how to improve your conversion rate and our funnel optimization playbook lay out the full process. Or just start with Kirro and run your first test today.
FAQ
What is the conversion rate formula?
Conversion rate = (conversions ÷ total visitors) × 100. If 200 people out of 8,000 visitors complete a purchase, your conversion rate is 2.5%. The formula itself is simple. The complexity is in defining what counts as a “conversion” and whether “visitors” means sessions or unique people.
How do you calculate ecommerce conversion rate?
Ecommerce conversion rate = (number of orders ÷ number of sessions) × 100. Most ecommerce platforms (Shopify, WooCommerce, BigCommerce) use sessions as the denominator by default. The average ecommerce conversion rate is 1.4-2.5% depending on the source and industry. Stores in the top 20% convert at 3.2% or higher.
Should I use sessions or users for conversion rate?
Use sessions for ecommerce and short purchase cycles. Use users for B2B and high-consideration purchases. The key rule: pick one and stay consistent over time. Switching between the two makes your data incomparable across periods. If you’re comparing to industry benchmarks, sessions is the safer choice since most published benchmarks use session-based rates.
What counts as a conversion?
Whatever action matters most to your business. For ecommerce, it’s a completed purchase. For SaaS, it’s a signup or trial start. For lead generation, it’s a form submission. You can also track micro conversions like add-to-cart or pricing page clicks, but keep those separate from your main conversion rate. Define your conversion before you start measuring, not after.
Why is my conversion rate different in different tools?
Different tools use different denominators (sessions vs users vs page views), different attribution windows (how far back they look to give credit for a conversion), and different definitions of “unique visitor.” GA4 and Shopify will show different numbers for the same store because they count differently. This doesn’t mean one is wrong. It means you should pick one source of truth and track trends from that single source.

Randy Wattilete
CRO expert and founder with nearly a decade running conversion experiments for companies from early-stage startups to global brands. Built programs for Nestlé, felyx, and Storytel. Founder of Kirro (A/B testing).
View all author posts