Conversion funnel optimization is finding where people drop out of your buying journey and fixing those spots. Stage by stage. Not all at once. Not by guessing. You measure each step, find the worst leak, test a fix, and repeat. It’s conversion rate optimization applied to each stage of your funnel.
Most guides tell you to “improve every stage.” That’s like a doctor saying “feel better.” It’s technically true and completely useless. This playbook gives you a specific order of operations, backed by data, so you know exactly where to start.
What conversion funnel optimization actually means
Already know what a conversion funnel is? Good. This post is about making yours work better.
The difference between understanding funnels and optimizing them is like reading a recipe vs. cooking dinner. One is knowledge. The other gets you fed.
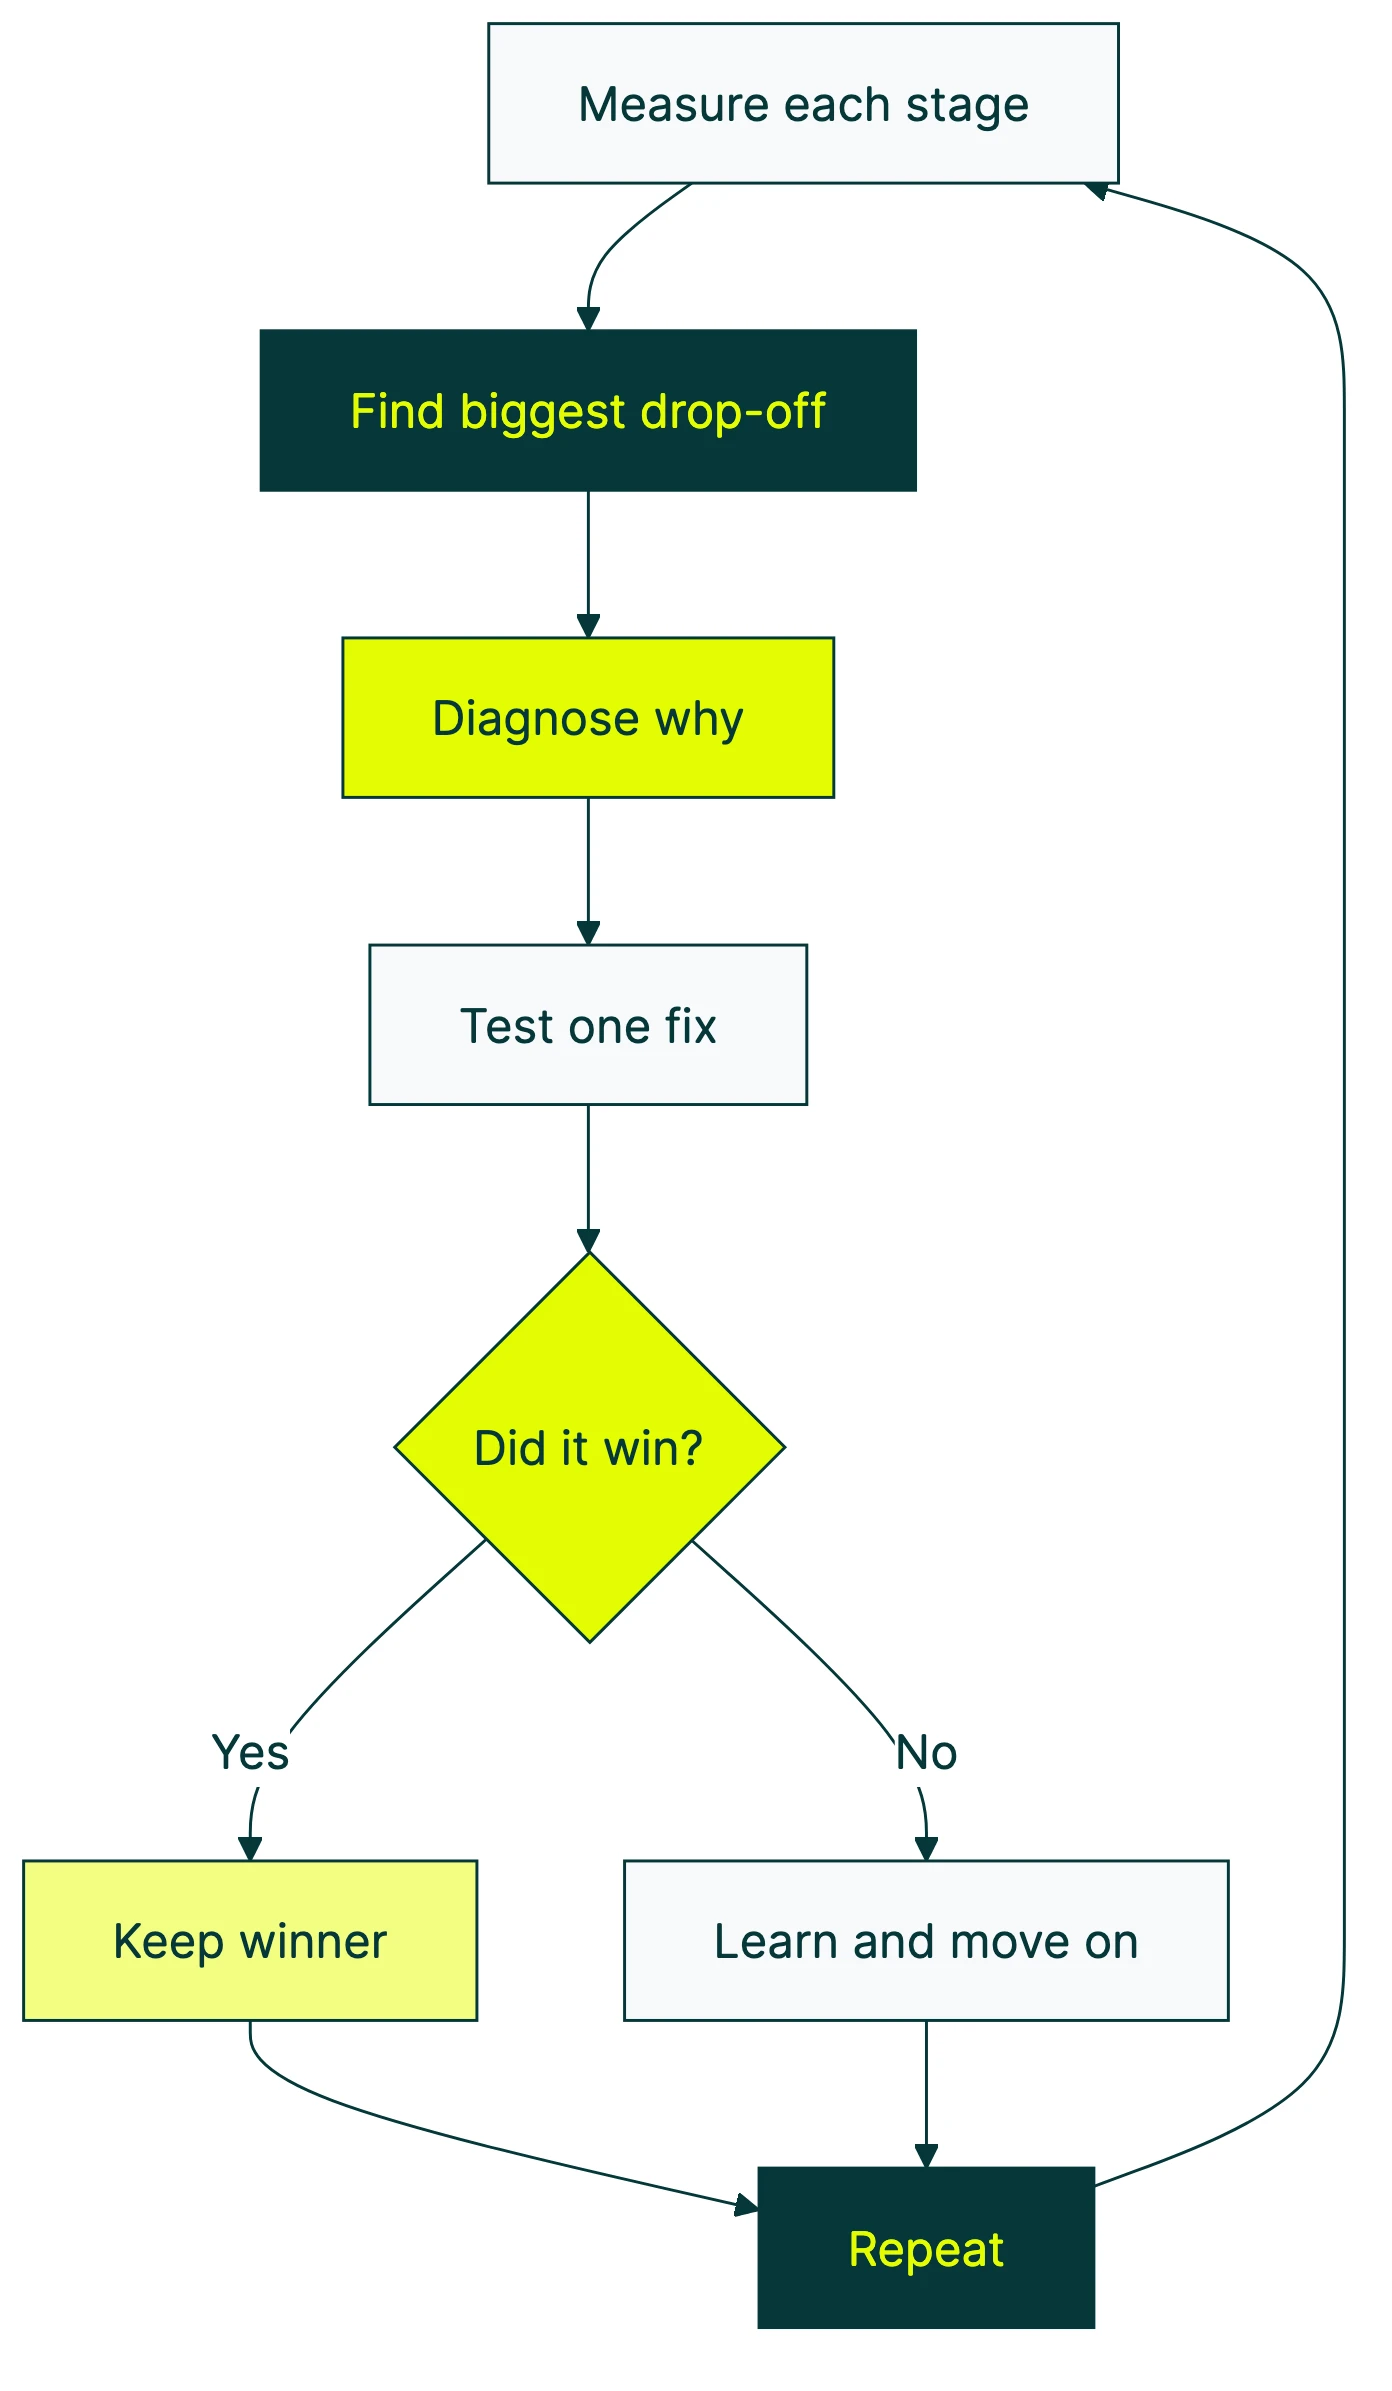
Here’s the loop:
- Measure the conversion rate at each stage of your funnel
- Find the stage with the biggest drop-off
- Figure out why people leave at that stage
- Test one change to fix it
- Keep the winner, move to the next worst stage
That’s it. It’s a repeating cycle, not a one-time project. If you want the full overview of what CRO is, we’ve got a separate guide for that. This post is the tactical playbook.
Our take: Most businesses skip steps 2 and 3. They jump straight to “change the button color” without knowing which stage is actually bleeding money. That’s not optimization. That’s redecorating.
For a deeper look at this optimization loop in practice, CXL walks through the full conversion rate optimization process:
Where the money really leaks (it’s not where you think)
This one will bug you once you see it.
Everyone obsesses over checkout abandonment. And yes, 70% of carts get abandoned. That’s real.
But checkout abandonment only affects people who already added something to their cart. What about the 83% who looked at your product page and left without adding anything?
Contentsquare’s data shows that the browse-to-cart stage is where most funnels bleed the most revenue. Picture a physical store: 100 people walk in, 83 leave without picking anything up, and you’re rearranging the checkout counter.
It gets worse. SimplicityDX found that poor product page experiences cost ecommerce businesses 14% of total site revenue. Not 14% of product page revenue. Total.
And according to Contentsquare’s 2025 benchmarks, conversion rates dropped 6.1% year over year despite 13.2% more ad spend. More money going in. Fewer conversions coming out. The bucket is leaking faster than you can fill it.
So before you spend another hour on checkout optimization, check whether your product pages are the real problem. They probably are.
How to fix the top of your funnel (awareness to interest)
The top of your funnel is about two things: getting the right people to your site and keeping them past the first page. You can’t fix the second one if you mess up the first.
Contentsquare reports that 53% of visitors bounce after viewing a single page. Half your traffic, gone in seconds. That’s not a funnel problem. That’s a front door problem.
The biggest lever here is making sure your page delivers what your ad promised. Marketers call it “message match.”
If your ad says “50% off running shoes” and your landing page shows your entire catalog, people leave. Same words. Same offer. Same vibe.
Unbounce found that pages written at a 5th-to-7th grade reading level convert at 11.1%. That’s 56% higher than 8th-to-9th grade pages. Simpler words, more sales. Not because your visitors are dumb. Because they’re scanning.
What to test at this stage:
- Headline variations (the single biggest lever on any page)
- Whether your landing page matches your ad copy word-for-word
- Page load speed (every second costs you conversions)
- How clear your value proposition is above the fold (the part of the page people see before scrolling)
Track bounce rate by traffic source. Your Google Ads traffic might behave totally differently from your organic visitors. Your conversion funnels analytics should break this down by channel. If you want a deeper look at what to measure, check our guide on conversion metrics that matter.
For the full playbook on landing page optimization, we have a dedicated guide.
How to fix the middle of your funnel (interest to desire)
This is the stage that separates browsing from buying intent. And it’s where most funnels quietly bleed out.
Dynamic Yield’s benchmarks put the global average add-to-cart rate at 6.8-7.5%. But the range is wild. Food and beverage stores hit 9.76%. Luxury brands? 2.28%.
If you don’t know your industry’s baseline, you’re flying blind.
Baymard Institute found that 82% of ecommerce sites have serious product page UX problems. Not minor issues. Serious ones that directly cost sales. That’s not a stat about bad companies. It’s about how hard this stage actually is to get right.
People don’t buy by doing math. A 2024 study in the Journal of Marketing Studies confirmed what CRO folks have known for years. Cognitive biases (mental shortcuts our brains take), not rational calculations, drive purchase behavior.
Loss aversion (“only 3 left in stock”) works because we fear missing out. Social proof (“47 people bought this today”) works because we trust crowds. Psychology, not manipulation.
Testing ideas:
- Social proof placement and type (reviews, purchase counts, testimonials)
- How you display pricing (anchor price, savings callout, payment plans)
- Product image quality and number of images
- Call-to-action button copy (yes, the words on the button matter)
The metrics to watch: add-to-cart rate, product page exit rate, and wishlist/save rate if you have one.
One thing we’ve noticed when testing product pages: the biggest wins rarely come from design changes. They come from answering the question the visitor is already asking.
“How much is shipping?” “Will this fit me?” “What if I don’t like it?” If your page doesn’t answer those within five seconds, people don’t scroll further. They leave.
For a full breakdown of what makes product pages convert, check out product page optimization. And for the broader principles, our CRO best practices guide covers the fundamentals.
How to fix the bottom of your funnel (desire to action)
You’ve gotten someone to add a product to their cart. They want to buy. Now your checkout has to not screw it up.
Baymard’s research found that the average checkout has 23.48 form elements but only needs 12-14. There’s $260 billion in recoverable orders sitting in abandoned carts, largely because checkouts ask too many questions. That’s not a rounding error. That’s a market.
Why do people abandon at checkout? The top reasons haven’t changed much:
- Unexpected costs at the end (39% of abandoners)
- Forced account creation (19%)
- Checkout was too complicated (18%)
One thing from the Shopify community: a store owner’s shipping cost was 61% of the product price. Checkout abandonment? 83%.
The community consensus was simple. Build shipping into the product price. Show one number. Stop surprising people.
Abandoned cart emails (those automatic “hey, you forgot something” reminders) are worth setting up. Klaviyo’s benchmarks show they recover 3.33% of abandoned carts on average. Top 10% of stores? 7.69%.
Revenue per recipient averages $3.65, but top performers hit $28.89. If you’re not sending these, you’re leaving easy money on the table.
What to test at checkout:
- Guest checkout vs. forced account creation
- Showing shipping costs earlier (or building them into the price)
- Number of checkout steps
- Payment options (more options = fewer bounces)
For the deep dive on checkout optimization strategies, including the 9 highest-impact tactics, see our dedicated guide. For specific checkout page optimization design tips, we have a focused companion post. And for Shopify stores specifically, our Shopify conversion rate tips cover this stage in detail.
Funnel math: why small improvements compound into big revenue
Most people treat funnel stages like separate projects. They’re not. They multiply.
The formula:
Revenue = Visitors x Stage 1 conversion rate x Stage 2 conversion rate x Stage 3 conversion rate x Average order value
Each stage is a multiplier. When you improve one, it amplifies everything downstream.
A worked example:
| Metric | Before | After (10% better) |
|---|---|---|
| Visitors | 10,000 | 10,000 |
| Add-to-cart rate | 8% | 8.8% |
| Checkout rate | 50% | 55% |
| Payment completion | 70% | 77% |
| Orders | 280 | 373 |
That’s 33% more orders from zero extra traffic. Three small improvements, compounding into a meaningful revenue jump.
Solid Growth’s model takes this further. Twelve 10% improvements across four areas (traffic, conversion, order value, retention) produce 214% revenue growth. Not 120%. Each improvement multiplies the others.
One more thing from Monetizely’s analysis: a 20% improvement at any single stage yields the same absolute revenue impact. So it doesn’t matter which stage you pick, as long as you pick the weakest one. The biggest drop-off is where you’ll find the easiest gains.
You can calculate your conversion rate at each stage, or use our conversion rate calculator to plug in your own numbers.
But you need to actually test each change to know if it helps. Kirro makes this straightforward. Pick a page, make a change with the visual editor, and see which version gets more conversions. No code. No developer queue.
A step-by-step optimization playbook
Theory is nice. Here’s what to actually do.
Phase 1: Map your funnel and measure each stage
Write down every step between “visitor lands on site” and “money in your account.” For most businesses, it’s something like: landing page → product/service page → cart/signup → checkout/payment → confirmation.
Then get your numbers. What percentage of people make it from each step to the next? If you need help with the measuring part, our funnel analysis deep dive walks through it step by step.
Phase 2: Find your worst drop-off
Look at each transition. Where’s the biggest absolute loss? Not percentages. Absolute numbers. If 10,000 people see your product page and 9,170 leave without adding to cart, that’s a bigger opportunity than 500 people abandoning checkout. Even if checkout has a higher abandonment “rate.”
Phase 3: Figure out why
Numbers tell you where. They don’t tell you why. For the why, you need:
- Session recordings (watch real people struggle with your page)
- On-page surveys (“What almost stopped you from buying today?”)
- Segment analysis (does mobile convert differently from desktop? Do different traffic sources behave differently?)
Phase 4: Test one change
One. Not five. If you change the headline, the image, and the button at the same time, you won’t know which change helped (or hurt).
Form a theory: “People leave the product page because they can’t tell how much shipping costs.” Then test a fix: add a shipping estimate below the price. Tools like Kirro let you test changes on any page with a visual editor. No code, no waiting for a developer.
For a deeper look at CRO testing methods, including when to use split tests vs. other approaches, we have a dedicated guide.
Phase 5: Keep the winner, repeat
If your change won, make it permanent. Then go back to Phase 2. Find the next biggest drop-off. Run another test.
This is a loop. Not a project with a finish date. The best CRO strategies treat optimization as an ongoing process.
One honest note: real customer journeys aren’t perfectly linear. Google’s “Messy Middle” research showed that people loop between exploring options and evaluating choices. They might visit your site five times from three different channels before buying.
The funnel model is still useful for measurement. But don’t be surprised when the data looks a bit messy. That’s normal.
Our take: If you can only do one thing from this entire post, do Phase 2. Most businesses have never actually measured the conversion rate at each funnel stage. Just getting those numbers will change what you prioritize.
Mistakes that sabotage your funnel optimization
Knowing what to do is half the battle. Here’s what not to do.
Mistake 1: Working on the wrong stage
This is the big one. You read an article about checkout optimization, so you spend two weeks on checkout. Meanwhile, your product pages are losing 83% of viewers.
Always start with the data. Find your biggest drop-off first, then fix it.
Mistake 2: Following “best practices” without testing
This one stings. CXL’s research found some uncomfortable truths:
- Adding trust seals (those “secure checkout” badges) decreased conversions by 1.6%
- Making buttons bigger decreased conversions by 10%
- Removing the Facebook login option increased conversions by 3%
Every “best practice” is just someone else’s test result on someone else’s site with someone else’s audience. On your site? It might backfire. The only way to know is to test it yourself.
Mistake 3: Testing too many changes at once
You changed the headline, swapped the hero image, moved the price, and added reviews all in one go. Conversions went up 15%. Which change did it? You have no idea. Test one thing at a time.
Mistake 4: Calling a winner too early
Qubit’s research estimated that poor A/B testing costs online retailers up to $13 billion per year in false positives. What looks like a winner after two days might just be random noise. Wait for your testing tool to tell you it’s confident. For more on common pitfalls, check our A/B testing mistakes guide.
Mistake 5: Ignoring mobile
Statista data shows mobile cart abandonment is 80.2% vs. 70% on desktop. If your funnel works great on a laptop but falls apart on a phone, you’re losing the majority of your traffic. Always check your mobile experience separately.
How to increase your conversion rate across the full funnel
Pull it all together:
- Measure each stage. You can’t fix what you can’t see. Track the conversion rate from one step to the next, not just overall site conversion rate. Use GA4 ecommerce tracking to get the numbers.
- Fix the weakest stage first. A 20% improvement at any stage yields the same revenue impact. Go where the gap is biggest.
- Use the compound effect. Three 10% improvements = 33% more revenue. Not 30%. The multiplication works in your favor.
- Test before you commit. Every change is a theory until proven otherwise. Kirro makes the testing part simple. Headlines, pricing display, button copy: that’s usually what moves the needle most.
- Repeat forever. This isn’t a project. It’s a practice.
If you want to know whether your numbers are good or bad, check our conversion rate benchmarks or look at funnel conversion rate benchmarks for stage-by-stage comparisons. And for lead conversion rates specifically, we’ve got you covered there too.
FAQ
How do you optimize a conversion funnel?
Map your funnel stages, measure the conversion rate at each transition, find the stage with the biggest absolute drop-off, diagnose why people leave, and test one change to fix it. Then repeat. Start with the stage losing the most potential customers. For most ecommerce sites, that’s the browse-to-cart stage, where 83% of product viewers leave without adding anything.
What is the best way to increase funnel conversion rate?
Fix the weakest stage first. Monetizely’s analysis shows that a 20% improvement at any single stage yields the same absolute revenue impact. So focus where the gap is largest. Usually, that’s the middle of the funnel (product pages), not the bottom (checkout).
Which funnel stage should I optimize first?
The one losing the most people in absolute numbers. Not the one with the highest percentage drop-off. Contentsquare data shows 83% of product page viewers don’t add to cart. For most sites, that browse-to-cart transition is the biggest opportunity. But check your own data first. Your funnel might be different.
What is a good conversion funnel rate?
It depends on your industry. Dynamic Yield’s benchmarks put global average ecommerce conversion at 2.79%. Food and beverage hits about 6%. Luxury is around 0.9%.
But overall conversion rate is less useful than stage-by-stage rates. A site converting at 3% might have a great landing page and a terrible checkout, or the reverse. Measure each transition separately. For more detail, see our funnel conversion rate benchmarks and what a good conversion rate looks like by industry.
Is a 2.5% conversion rate good?
For ecommerce, 2.5% is slightly below the global average of 2.79% (Dynamic Yield). For SaaS landing pages, it’s below the 3.8% median (Unbounce). But a single number doesn’t tell you much. You might have a 2.5% overall rate because your landing page converts brilliantly and your checkout is broken. Or the reverse. Break it down by stage to find where the real opportunity is.

Randy Wattilete
CRO expert and founder with nearly a decade running conversion experiments for companies from early-stage startups to global brands. Built programs for Nestlé, felyx, and Storytel. Founder of Kirro (A/B testing).
View all author posts