To increase your conversion rate, start with your value proposition. Then reduce checkout friction. Then speed up your pages, add social proof, and test every change. That priority order comes from research across 20,000+ tested pages that measured which conversion rate optimization changes actually move the needle.
Most “how to increase conversion rate” articles throw 20 tips at you and call it a day. No ranking. No priority. Just a wall of suggestions and a “good luck.”
This one is different. Every section below is ordered by measured impact, based on a CRO strategy that prioritizes what moves the needle most. And if you’re not sure where your site is losing people, we start there.
| Priority | Change | Typical impact |
|---|---|---|
| 1 | Fix your value proposition | 3x the weight of friction fixes |
| 2 | Remove checkout/form friction | Up to 35% conversion recovery |
| 3 | Speed up your pages | +8.4% conversions per 0.1s faster |
| 4 | Add social proof | +76.7% with even a few reviews |
| 5 | Test every change | Avoids the 80% of changes that fail |
Start here: find where you’re losing people
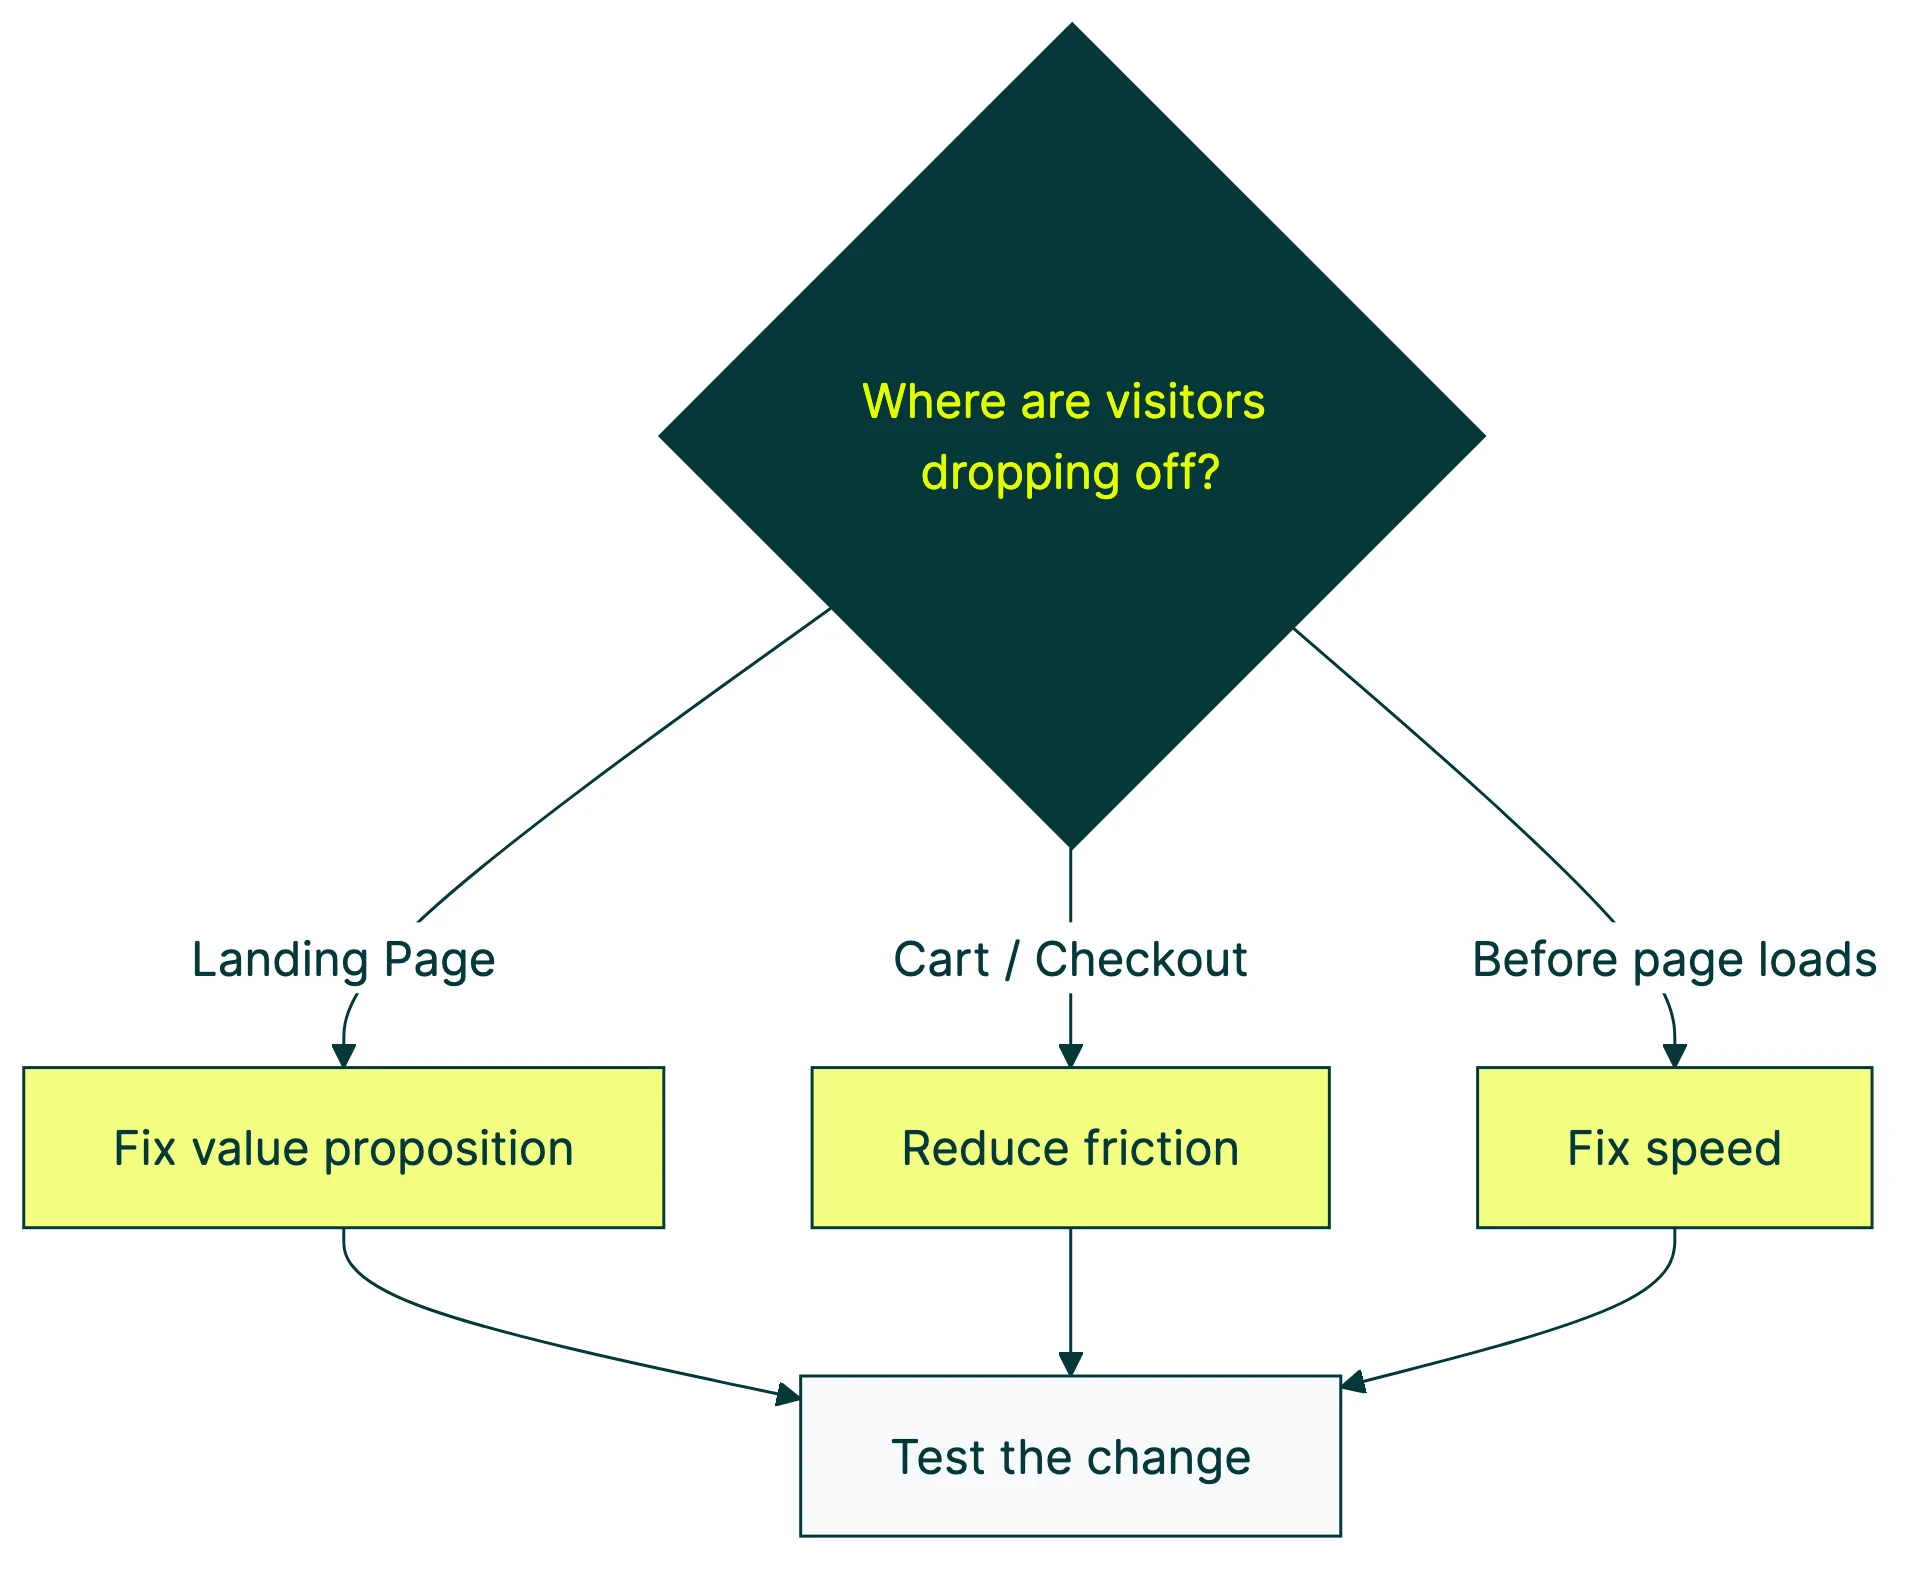
Open your analytics (Google Analytics 4, or whatever you use) and look at how people move through your site. They land on a page. Maybe click to a product page. Maybe add something to a cart or fill out a form. And then they either finish or leave.
Where do they leave? That’s your answer.
If nobody clicks your main button on the landing page, your headline or value proposition is the problem. If people add items to the cart but bail at checkout, that’s a friction problem. If they leave before the page even loads, that’s a speed problem.
Each of these has a different fix. Applying checkout fixes to a landing page problem is like putting a bandage on a headache.
Our conversion funnel guide walks through this in detail, and our guide to stage-by-stage funnel optimization shows you how to fix each stage once you’ve found the leak. Need help getting the data? Start with our GA4 conversion tracking setup. You can also use our conversion rate calculator to see where you stand right now.
Our take: Skip the generic advice. Find your specific bottleneck first. Ten minutes in your analytics will save you weeks of fixing the wrong thing.
Fix your value proposition first (it has 3x the impact)
Your value proposition is the answer to one question: why should someone buy from you instead of anyone else?
Researchers at MECLABS tested 20,000+ pages and scored each conversion factor by how much it matters. Value proposition scored 3 out of 4. Friction reduction scored 2. So a stronger value proposition matters roughly 50% more than making your checkout easier.
Try the “five-second test.” Show your homepage to someone who’s never seen it. After five seconds, ask them what you sell and why it’s worth buying. If they can’t answer both, your value proposition needs work.
Joanna Wiebe (the person who basically invented conversion copywriting) has documented headline rewrites that produced 400%+ increases in button clicks. Not small tweaks. Massive shifts from saying the right thing above the fold (that means the part of the page you see without scrolling).
What to do:
- Rewrite your headline using your customers’ actual words. Check reviews, support tickets, and sales call notes.
- Put the main benefit in the first thing people see. No scrolling required.
- Kill the jargon. If your mom wouldn’t understand it, rewrite it.
Don’t just rewrite your headline based on a gut feeling, though. Test both versions and let your visitors decide which one converts better. Gut feelings are wrong more often than you’d think (more on that later).
Remove checkout and form friction
Baymard Institute aggregated 50 studies and found a 70.22% average cart abandonment rate. Seven out of ten people who add something to their cart never buy it.
The top reasons:
- Unexpected costs (shipping, taxes, fees) hit 39% of shoppers
- Required account creation made 24% of US shoppers abandon entirely
- Checkout was too complicated for 18%
Baymard estimates that better checkout design alone could recover 35.26% of lost conversions. Across US and EU ecommerce, that’s $260 billion in recoverable orders. Billion with a B.
The average US checkout has 23.48 form elements. The optimal number? 12. That’s almost half gone.
There’s a famous case from Expedia: they removed one unnecessary form field (“Company”) and it increased revenue by $12 million per year. One field. Twelve million dollars.
What to do:
- Let people buy without creating an account. Guest checkout isn’t optional anymore.
- Show the total cost upfront. Shipping, taxes, all of it. No surprises at the last step.
- Cut every form field you don’t absolutely need. If you’re asking for a fax number in 2026, we need to talk. (Not sure where your forms stand? Learn how to improve your form conversion rate with field-level benchmarks, or see our guide on lead form optimization for what fields to include.)
For more on this, check out our checkout optimization strategies guide, our product page optimization guide, our guide on ecommerce conversion improvements, and landing page improvements. If you’re on Shopify specifically, see how to increase conversion rate on Shopify.
Speed up your pages (every tenth of a second counts)
Google and Deloitte studied 37 brand websites across 30 million sessions. The finding: 0.1 seconds faster = 8.4% more conversions in retail. Plus a 9.2% bump in average order value.
Google’s own research shows it gets worse from there. When load time goes from 1 second to 7 seconds, the chance someone leaves jumps by 113%. More than half of mobile visitors leave if your site takes over 3 seconds.
This is the one area where you don’t need to test. Faster is always better. Nobody ever said “I wish this page loaded slower.”
What to do:
- Compress your images. A 4MB hero image is not impressing anyone.
- Remove scripts you’re not using. Every tracking pixel and chat widget adds weight.
- Use a service that stores copies of your site closer to your visitors (the industry calls this a CDN). It makes pages load faster for people who aren’t near your server.
- Check Google PageSpeed Insights. It’s free and tells you exactly what to fix.
Add social proof that actually converts
PowerReviews surveyed 21,279 consumers. Products with just 1 to 100 reviews had a 76.7% higher conversion rate than products with none. At 5,000+ reviews, the lift hit 292.6%. Need inspiration? Here are real social proof examples from businesses you can actually learn from.
That’s not a subtle effect. Going from zero reviews to a few reviews is one of the biggest single changes you can make.
BrightLocal’s 2024 survey backs this up: 75% of consumers always or regularly read reviews before buying. Half of them trust online reviews as much as a personal recommendation from a friend.
And it’s not just surveys. Researchers combined 156 separate studies covering 69,006 observations. Same conclusion: what reviewers say about a product has a massive effect on whether people buy.
Types of social proof that work:
- Customer reviews (the most powerful, by far)
- Specific testimonials with real names and details
- Customer counts (“Join 12,000 teams”)
- Trust badges and security seals near the buy button
- Case studies with real numbers
Not sure which format works best on your page? Test testimonials vs. review counts vs. trust badges and let the data pick the winner. What works for one site bombs on another.
Read more in our CRO best practices guide and CRO recommendations.
Test every change (because most “best practices” don’t work)
Most articles hand you 15 tips and say “implement them all.” Research from Microsoft and Harvard says that’s a bad idea. They found that only 10-20% of experiments at Google and Bing produce positive results. At Microsoft, one in three ideas actually helps. The other two? They do nothing or make things worse.
That’s not a fluke. The Nielsen Norman Group tracked average conversion gains from website improvements over 14 years. The gains dropped from 247% in 2006 to 75% in 2020. The easy wins are mostly picked.
CXL has documented cases where “best practices” backfired. Bigger buttons decreased conversions by 10%+ in one test. Human faces on a page hurt conversions when the person was looking the wrong direction. The stuff that “always works” sometimes doesn’t.
And then there’s the Bing headline story. Someone proposed a headline change. It sat on a shelf for months. When they finally tested it, it turned out to be worth $100 million in annual revenue. Shelved. For months. The same applies to pricing — testing price points is one of the most overlooked conversion levers, and one of the most impactful.
This is why you test. Your intuition is wrong more than you’d like to admit. Even if you’re an expert.
Kirro makes testing simple enough to do between meetings. Pick a page, change a headline, and see what wins. No developer needed, no statistics degree required. Read more about A/B testing and conversion rates or explore different CRO testing methods.
Our take: “Best practices” are averages. Your site, your visitors, your product. The only way to know what works is to test it. Everything else is guessing with extra steps.
The traffic question nobody talks about
Peep Laja (founder of CXL) puts it bluntly: sites with fewer than 1,000 conversions per month shouldn’t run standard A/B tests. Not visitors. Conversions. The numbers just won’t be reliable enough.
Conversion Rate Experts says something similar. If a test takes months to reach a reliable answer, the cost of waiting eats the benefit.
For sites with less traffic, focus on qualitative methods instead. Watch session recordings to see where people get stuck. Interview actual customers. Study what competitors do differently.
Most “how to increase conversion rate” articles won’t say this, so we will: if you’re getting fewer than 10,000 visits per month, better traffic will do more for you than better conversion. Squeezing extra percentage points out of 500 visitors doesn’t move the needle the way 5,000 of the right visitors does.
Kirro uses math that works with less traffic (experts call this Bayesian statistics). You get answers faster with smaller numbers. But if you’re under 1,000 visitors a month, drive more of the right people to your site first. Our guide on what counts as a good conversion rate has benchmarks for your industry.
Knowing your baseline matters more than most people realize. Here’s the reading order: start with what conversion rate optimization is, then our CRO strategy guide for the big picture. When you’re ready for execution, our guide on how to optimize conversion rate walks through each step.
FAQ
What is the fastest way to increase conversion rate?
Fix your value proposition. According to MECLABS research across 20,000+ pages, your value proposition has 3x more impact on conversions than reducing friction. Rewrite your headline to clearly state why someone should buy from you, then test it. For the full step-by-step process, read our guide on how to optimize conversion rate.
What is a good conversion rate?
It depends on your industry. The global ecommerce average is 2.79% (Dynamic Yield, 300 million+ sessions). But the range is massive: food and beverage averages 6%, beauty sits around 4.2%, fashion is 2.9%, and luxury hovers at 0.9%.
For Google Ads, the average search conversion rate is 7.52% (WordStream, 16,000 campaigns). Don’t compare yourself to a generic “2-3% is good” benchmark. Compare to your specific vertical. See our full breakdown of good conversion rate benchmarks.
How much can A/B testing improve conversion rate?
Individual tests typically produce 5-15% lifts. The era of 200%+ gains is largely over, according to NNG’s longitudinal research. But compounding matters: five sequential 10% improvements compound to a 61% total improvement. The real value of testing isn’t the wins. It’s avoiding the changes that hurt. At Microsoft, two-thirds of proposed changes either did nothing or made things worse. Learn more about A/B testing and conversion rates.
Is a 2.5% conversion rate good?
For overall ecommerce, 2.5% is slightly below the global average of 2.79% (Dynamic Yield). But context changes everything. If you sell luxury jewelry (industry average 0.9%), a 2.5% rate is exceptional. If you sell food and beverages (industry average 6%), it’s a red flag. Always benchmark against your specific vertical, not a generic number.
What conversion rate should I aim for?
Aim to beat your own current rate. Forget arbitrary benchmarks. Use the diagnostic approach from the top of this article: find where you’re losing visitors, fix the highest-impact issue first, test the change, repeat. Consistent 5-10% improvements compound dramatically over time. Five 10% improvements don’t add up to 50%. They compound to 61%.

Randy Wattilete
CRO expert and founder with nearly a decade running conversion experiments for companies from early-stage startups to global brands. Built programs for Nestlé, felyx, and Storytel. Founder of Kirro (A/B testing).
View all author posts