A conversion funnel is the path someone takes from first hearing about your business to completing a goal. That goal could be a purchase, a signup, or a quote request. It’s called a “funnel” because lots of people enter at the top, and fewer make it through each step.
Think of a physical store. A hundred people walk past. Thirty walk in. Ten try something on. Three buy. That’s a funnel. Your website works the same way, just with clicks instead of footsteps.
The useful part isn’t the shape. It’s that you can measure each step, find the one where the most people leave, and fix it. That’s conversion rate optimization in action. That one fix can change your revenue more than all your marketing combined.
Here’s how that works for your specific business model, backed by real data. (Calculate your rate at each funnel stage with the conversion rate calculator.)
What is a conversion funnel
A conversion funnel maps every decision point between a visitor’s first click and the thing you want them to do. Purchase. Signup. Demo request. Whatever “conversion” means for your business.
Some people call it a sales funnel. Others call it a marketing funnel or a purchase funnel. Different names, same idea: people move through stages, and some drop off at each one.
The important thing to understand early: the funnel is a model. It’s a useful way to think about your business, not an exact description of how real people behave. (More on that later.)
But as a model, it’s genuinely powerful. It gives you a framework to find problems. Instead of staring at your overall conversion rate wondering why it’s low, you can pinpoint exactly where people bail. That’s where the money is.
The stages of a conversion funnel
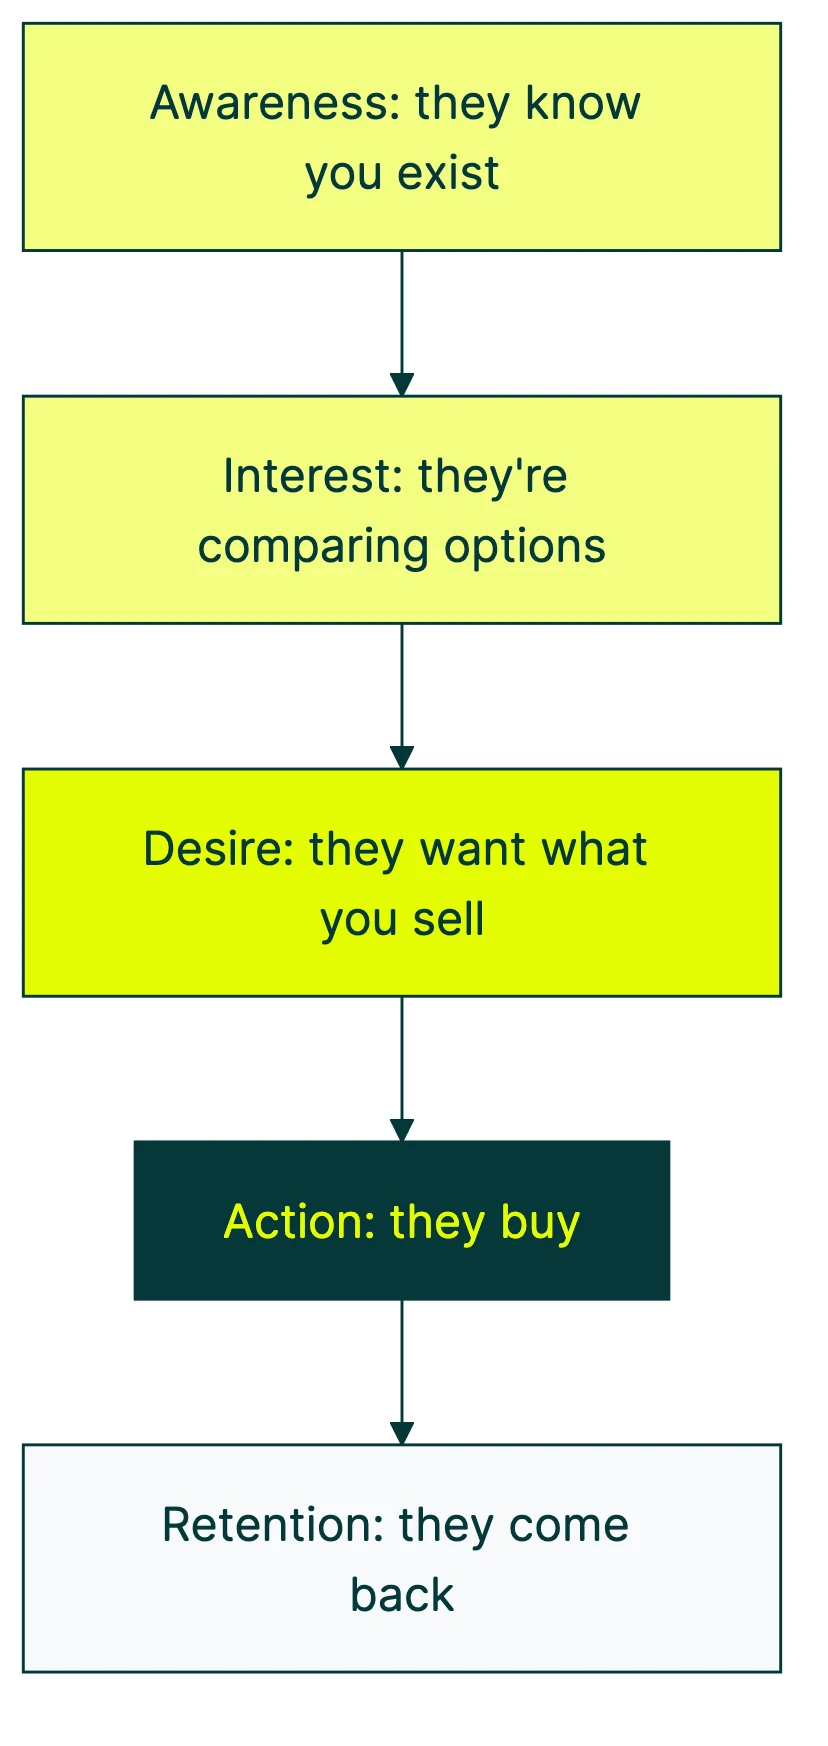
The most common framework uses four stages, sometimes called AIDA (an acronym marketers have used for over a century):
- Awareness. They know you exist. Maybe they found you through search, an ad, or a friend. They’re just looking around. At this stage, visitors are often choosing between a landing page or a website experience.
- Interest. Something caught their attention. They’re reading your product page, checking pricing, comparing you to alternatives.
- Desire. They want what you’re selling. They’re adding to cart, starting a free trial, or filling out a form.
- Action. They convert. Purchase complete. Signup done. Meeting booked.
You’ll also hear marketers say “top of funnel” (TOFU), “middle of funnel” (MOFU), and “bottom of funnel” (BOFU). Same idea with a food-related acronym. CRO people love their acronyms.
Here’s what matters more than the labels: at each stage, your visitor is asking a different question. At the top, it’s “what is this?” At the bottom, it’s “should I pull the trigger?” The metrics that matter change at each stage too, and tracking the right conversion rate metrics at each stage helps you spot where the funnel breaks. At the top, you’re watching CTR. At the bottom, you care about understanding your click-to-conversion rate.
And don’t forget what happens after the sale. Retention, repeat purchases, referrals. The funnel doesn’t end at the receipt. Some of your best customers started as one-time buyers who had a great experience and came back.
Here’s what the classic conversion funnel marketing model looks like:
Our take: The exact number of stages doesn’t matter. Three stages, four, five. Pick what fits your business. The principle is what counts: people move from “never heard of you” to “ready to buy” through a series of small decisions. Your job is to make each decision easy.
Conversion funnels by business model
Every competitor article about conversion funnels gives you one generic diagram and calls it a day. That’s lazy. Your funnel should match your business model. The stages, the metrics, and the benchmarks are completely different depending on what you sell. Our conversion funnels analytics guide covers how to measure each model.
Ecommerce conversion funnel
If you sell products online, your funnel looks like this:
Homepage/category page → Product page → Add to cart → Checkout → Purchase
The big number you need to know: 70.22% of online shopping carts get abandoned before checkout. That’s the average across 50 different studies compiled by Baymard Institute.
Why do people abandon? The top three reasons:
- Extra costs they didn’t expect, like shipping or taxes (39%)
- Forced account creation (21%)
- Checkout was too complicated (18%)
And “too complicated” is backed by data. The average checkout has 11.3 form fields. Baymard’s research shows that 7-8 is ideal. Every extra field is friction. Every field is a chance for someone to think “I’ll come back later” (they won’t).
If you’re tracking this in Google Analytics, here’s how to set up ecommerce conversion tracking properly.
Say you sell $100 products and get 10,000 visitors a month. Cutting your cart abandonment from 70% to 60% could mean dozens of extra sales. That’s thousands in revenue from fixing a form, not buying more ads. For the full picture on optimizing ecommerce conversions, we wrote a dedicated guide. Our ecommerce conversion rate optimization checklist covers the specific fixes that reduce drop-off at each stage.
SaaS funnel
If you sell software with a free trial or freemium tier:
Landing page → Free trial/freemium signup → Activation → Paid conversion
The median conversion rate from free to paid is 8%, according to ChartMogul’s data across 200 SaaS products.
The credit card question changes everything:
- Credit card required trials: 25-60% convert to paid
- No credit card trials: 4-6% convert to paid
Looks like requiring a card is a no-brainer, right? Not so fast. No-card trials get way more signups in the first place. The total revenue often ends up similar.
It depends on your traffic volume and your product’s “aha moment.”
For freemium specifically, Lenny Rachitsky’s analysis of over 1,000 SaaS products found that 3-5% free-to-paid is good, and 8-12% is great.
If you’re working on your landing page, the signup step is where small changes make a big difference. For a deeper look at what “good” looks like at each stage, see our SaaS funnel conversion benchmarks. For cross-industry context on trial-to-paid conversion specifically, we cover that in a dedicated guide.
B2B / sales conversion funnel
If you sell to other businesses through sales calls or demos:
Content/ads → Lead capture → Marketing qualified lead (MQL) → Sales qualified lead (SQL) → Opportunity → Close
Marketing qualified lead just means “someone who’s shown enough interest that the marketing team thinks they might buy.” Sales qualified means “a salesperson has talked to them and agrees.”
HubSpot’s data shows the typical B2B benchmarks: about 2.3% of website visitors become leads. Of those leads, roughly 13% become sales qualified.
Gartner’s research adds another reality check: B2B buyers spend only 17% of their evaluation time talking to any supplier. And 61% of them prefer a rep-free buying experience entirely.
That means most of your funnel happens where you can’t see it. Your buyer is Googling you, reading reviews, comparing alternatives, and asking peers. Your job is to make sure the information they find is good. For more on this, check out lead generation conversion rates and our guide to lead conversion rate at each stage. And if your sales team uses outbound calls, the cold call conversion funnel has its own stage-by-stage benchmarks.
Mobile app funnel
If you’re building a mobile app, the funnel has its own shape: App store listing → Install → Onboarding → Activation → Payment. Each stage has wildly different benchmarks. For example, app store install rates average 25-27%, but only 2-5% of freemium users ever pay. Understanding mobile app conversion rates at each funnel stage helps you figure out which transition to fix first.
Marketplace funnel
If you run a two-sided marketplace (think Airbnb, Etsy, or a B2B marketplace):
Discovery → Listing view → Inquiry/add to cart → Transaction → Review
The twist: you have two funnels. One for buyers and one for sellers. A marketplace only works when both sides convert. That’s twice the leak-hunting.
Most marketplace founders focus on supply (getting sellers/hosts/providers on board) and forget that buyer conversion is a completely separate problem. The review stage is particularly important here. Reviews build trust for future buyers and keep sellers accountable. Without them, both funnels suffer.
Our take: If you’ve been staring at a generic AIDA diagram wondering why it doesn’t match your business, this is why. Your ecommerce cart abandonment problem is not the same as a SaaS activation problem. Match the model to what you actually sell, then measure each step. Generic advice gives you generic results.
Why the funnel isn’t really a funnel
The AIDA model (awareness, interest, desire, action) has been around for over a century. And for most of that time, nobody actually tested whether people follow it.
In 1999, researchers Vakratsas and Ambler reviewed over 250 advertising studies and found little empirical support for any hierarchy-of-effects model. People don’t reliably move through awareness → interest → desire → action in that order. They just… don’t.
Then McKinsey studied 125,000+ consumer journeys in 2009. They found that two-thirds of touchpoints during evaluation are consumer-driven: reviews, word-of-mouth, independent research. Not brand-initiated. Consumers also add AND drop brands during evaluation. The funnel isn’t a one-way narrowing. People wander.
Google’s “Messy Middle” research in 2020 backed this up with 310,000 purchase scenarios. Consumers loop between exploring options and evaluating them, driven by cognitive biases. A completely fictional brand won 87% of buyer preference when it used all six biases well. Brand loyalty alone doesn’t protect you.
Edelman’s 2023 research across 14,000 consumers backs this up. 78% of people discover things that attract them to a brand after they’ve already purchased. The funnel treats the sale as the finish line. In reality, post-purchase is where loyalty gets built.
So is the funnel useless? No. It’s still the best tool for finding where people drop off. But don’t assume your customers walk through it in order. They Google you, leave, come back two weeks later from an Instagram ad, read three reviews, compare you to two competitors, and then buy. The funnel is a map, not the territory.
Use it for measurement. Don’t mistake it for how your customers actually think.
Funnel math: how fixing one stage changes your revenue
This is the part that makes the whole funnel concept worth caring about. Let’s use real numbers.
Say you run an ecommerce store with 10,000 monthly visitors. Your funnel looks like this:
| Stage | Visitors | Conversion to next stage |
|---|---|---|
| View product | 3,000 | 30% of visitors |
| Add to cart | 900 | 30% of viewers |
| Start checkout | 270 | 30% of cart-adds |
| Purchase | 81 | 30% of checkouts |
Overall conversion rate: 0.81%. That means 81 out of 10,000 visitors buy something.
Now, what if you improve just the add-to-cart rate from 30% to 35%? Maybe you add better product photos, or you test a different “add to cart” button. Just that one change:
| Stage | Visitors | Conversion to next stage |
|---|---|---|
| View product | 3,000 | 30% |
| Add to cart | 1,050 | 35% |
| Start checkout | 315 | 30% |
| Purchase | 95 | 30% |
New overall conversion rate: 0.95%. That’s 17% more revenue from improving one stage by 5 percentage points.
The formula is simple: overall conversion rate = stage 1 rate × stage 2 rate × stage 3 rate × stage 4 rate. Each stage multiplies through. Here’s how to calculate conversion rate at each stage.
The key insight: focus on the stage with the biggest absolute drop-off, not the lowest percentage. If 7,000 people leave before viewing a product but only 630 leave during checkout, the product page is where your money is.
Baymard Institute estimates that 35% of lost ecommerce revenue is recoverable through better checkout design alone. Across the US and EU, that’s roughly $260 billion in recoverable revenue. Not from more ads or more traffic. Just from not making checkout annoying. Our checkout optimization guide covers the specific fixes that recover that lost revenue.
Once you know which stage leaks the most revenue, test a change. You can A/B test a specific page (like your checkout or product page) to validate the fix before going all-in. Kirro lets you do this without code, so you can test a new product page layout or checkout flow and see if the numbers actually move.
How to set up your conversion funnel
This is the practical part. Keep it simple. You don’t need a complicated analytics setup to start.
Step 1: Define your stages. Use the business model templates above. Pick 4-6 stages that match how people actually buy from you. Don’t overcomplicate it with 12 stages before you have the data to support them.
Step 2: Set up tracking. Each stage transition should be a trackable event. In GA4, these are “key events.” You can track conversion rates in GA4 with the built-in funnel exploration report, and our goal conversion rate guide explains how to choose which goals to mark as key events. Whatever conversion funnel analytics tool you use, you need to know how many people reach each stage.
Step 3: Measure each stage’s conversion rate. Use our conversion rate calculator to quickly run the math for each stage, or calculate the conversion rate manually. Write these numbers down somewhere visible. A spreadsheet works fine.
Step 4: Find your biggest drop-off point. This is where to focus. Don’t get distracted by stages that are already decent. Find the worst leak and fix that first. If you want a structured approach, run a CRO audit on the page where the biggest drop happens.
Step 5: Test a change. Figure out why people leave at that stage. Build your fix. Test it. Kirro integrates with GA4, so your existing conversion tracking becomes your test measurement. No extra setup. When you’re ready to go deeper, here’s how to build a complete CRO strategy around your funnel data.
For a more detailed walkthrough on conversion funnel analysis with data, check out our guide on funnel analysis. And when you’re ready to start improving specific stages, our guide to optimize your conversion funnel covers the tactical playbook.
Common conversion funnel mistakes
After looking at hundreds of funnels, the same mistakes keep showing up. Here’s what to watch for.
Your CEO wants more traffic. But your checkout converts at 12% when industry average is 30%. More traffic just means more people hitting a broken checkout. Fix the leak before you turn up the faucet. Kirro can help you test a fix on that one broken page before you spend another dollar on ads.
An ecommerce site and a B2B consulting firm have nothing in common at the funnel level. Applying the same framework to both is like using the same recipe for pizza and sushi. Match the model to your business (see the templates above).
Then there’s post-purchase. The funnel doesn’t end when someone buys. Repeat customers are cheaper to convert than new ones, and referrals are basically free marketing. Treat post-purchase as a stage worth measuring.
Only measuring last-click. Salesforce’s data shows 64% of customers switch devices during a purchase. If you’re only tracking the last click, you’re missing most of the story. Someone might discover you on their phone, research on their laptop, and buy on their tablet.
How many stages do you actually need? Five is plenty to start. You can add detail later when you have the data. We’ve seen teams spend weeks setting up 12-stage funnels and then never look at the numbers. Start with 4-5 stages. Get comfortable reading them. Add granularity when you actually need it.
And don’t build funnels around your internal process. Your internal steps (marketing handoff, sales qualification, contract review) aren’t the customer’s journey. Map the funnel from their perspective. Ask yourself: “what is the visitor doing at this stage?” not “what is our team doing?” A CRO audit helps you see your site the way a visitor does, not the way your org chart does.
FAQ
What is a conversion funnel?
A conversion funnel is the path visitors take from discovering your business to completing a desired action, like making a purchase or signing up. It’s called a “funnel” because fewer people make it through each step. The concept helps you identify exactly where you’re losing potential customers so you can fix the biggest leak first.
What is a good funnel conversion rate?
It depends on your business model. For ecommerce, an overall conversion rate of 1-3% is typical. For SaaS free-to-paid, 3-8% is solid. For B2B lead-to-close, it varies wildly by industry and deal size. The more useful metric is your stage-by-stage rate, because that tells you where you’re losing people. Check out our funnel conversion rate benchmarks for detailed numbers by industry and stage, or see what a good conversion rate looks like more broadly.
What is another name for a conversion funnel?
Sales funnel, marketing funnel, purchase funnel, customer journey funnel. Different names for the same concept. “Sales funnel” tends to describe the seller’s perspective (prospecting, qualifying, closing), while “conversion funnel” focuses on the buyer’s journey. In practice, they describe the same process from different angles.
How do you improve a conversion funnel?
Find your biggest drop-off stage, figure out why people leave, and test a change. The highest-impact fix is almost always the stage with the biggest absolute drop-off, not the lowest percentage. Don’t try to fix everything at once. For CRO testing methods and a step-by-step playbook, see our guide on conversion funnel improvement.
How is a conversion funnel different from a sales funnel?
A sales funnel describes the seller’s process: prospecting, qualifying, presenting, closing. A conversion funnel describes the buyer’s journey: discovering, evaluating, deciding, acting. They’re looking at the same process from opposite sides. In modern marketing, “conversion funnel” is more common because it focuses on what the customer does, not what your sales team does.

Randy Wattilete
CRO expert and founder with nearly a decade running conversion experiments for companies from early-stage startups to global brands. Built programs for Nestlé, felyx, and Storytel. Founder of Kirro (A/B testing).
View all author posts