Your goal conversion rate is the percentage of visitors who do a specific thing you care about on your site. Buy something. Fill out a form. Sign up for a trial. If 1,000 people visit and 30 of them sign up, your goal conversion rate for signups is 3%.
Simple math. But the concept gets tangled fast, especially if you’re using Google Analytics. Google renamed “goals” to “conversions.” Then renamed “conversions” to “key events.” And now the terminology depends on whether you’re in GA4 or Google Ads. No wonder people are confused.
This guide cuts through that. You’ll learn how goal conversion rate actually works, how it changed with GA4, and (most importantly) which goals are worth tracking in the first place. It ties directly into conversion rate optimization and knowing your benchmarks.
What is goal conversion rate?
The formula is straightforward:
Goal conversion rate = (goal completions ÷ total sessions) × 100
This follows the same principle as calculating conversion rate in general, just scoped to a single goal rather than all conversions combined. In ad platforms, you’ll see this same concept abbreviated as CVR.
Say you run a SaaS company. You’re tracking three goals: free trial signups, pricing page visits, and demo requests. In one month, you get 10,000 sessions. Here’s what the numbers might look like:
| Goal | Completions | Goal conversion rate |
|---|---|---|
| Free trial signup | 210 | 2.1% |
| Pricing page visit | 830 | 8.3% |
| Demo request | 90 | 0.9% |
Same website. Same traffic. Very different rates. That’s normal, and it’s exactly why tracking individual goal conversion rates matters more than a single “site conversion rate.”
Your overall conversion rate squishes everything together. Goal conversion rate breaks it apart so you can see what’s actually happening.
Think of it like a report card. An overall GPA tells you something, but you need the individual grades to know which class needs work. If you want to run the math on a specific goal without setting up a full analytics report, our sales conversion rate calculator lets you calculate any goal’s rate from raw completions and sessions.
Our take: Most analytics tools let you track dozens of goals. Just because you can doesn’t mean you should. Track 5 to 10 that tie directly to revenue. Everything else is noise.
Goal conversion rate in Google Analytics
If you’ve used Google Analytics for more than a couple years, you’ve lived through a naming rollercoaster. The short version: everything you knew about “goals” changed.
The timeline
| Era | System | What goals were called | Limit |
|---|---|---|---|
| 2005 to 2023 | Universal Analytics (UA) | Goals | 20 per view |
| 2020 to March 2024 | GA4 (early) | Conversions | 30 per property |
| March 2024 onward | GA4 (current) | Key events | 30 per property |
Why did Google keep renaming things? Because GA4’s “conversion” numbers weren’t matching Google Ads conversion numbers. A campaign might show 50 purchases in GA4 but 76 conversions in Google Ads. (Ads includes modeled store visits and other extras.) So Google split the terminology: “key events” for your GA4 analytics, “conversions” for Google Ads bidding.
What actually changed (not just the name)
The naming is annoying, but the real difference is how GA4 counts things:
| Universal Analytics | GA4 | |
|---|---|---|
| Counting | Once per session (even if someone submits a form twice) | Every time (two form submissions = two key events) |
| Goal types | 4 types: destination, duration, pages/session, event | Events only (everything is an event) |
| Rate metric | ”Goal conversion rate" | "Session key event rate” and “user key event rate” |
| Retroactive? | No, changes only apply going forward | Same |
That counting change is a big deal. If someone downloads the same PDF twice in one visit, GA4 counts it as two conversions. UA counted it once. So your GA4 numbers may look inflated compared to your old UA reports. You didn’t suddenly get better at converting. The math just changed.
For the full walkthrough on setting up conversion tracking in GA4, check our GA4 conversion rate guide.
Our take: The name changes are frustrating. But the underlying feature got better. GA4’s event model is more flexible than UA’s rigid four goal types. The transition just could have been… smoother.
Where to find your goal conversion rate in GA4
In GA4, look for two metrics:
- Session key event rate: What percentage of visits included a key event. This is the closest equivalent to UA’s old “goal conversion rate.”
- User key event rate: What percentage of people triggered a key event, across all their visits.
Both live in your GA4 reports under the “key events” column. You can also find them in the Explorations tool if you want to slice the data by traffic source, device, or landing page.
If you’re tracking ecommerce conversion rates in Google Analytics, the same key event framework applies. Purchases, add-to-cart actions, and checkout starts are all events you can mark as key events.
Sessions vs users: which denominator to use
GA4 offers two denominators, and they answer different questions.
Here’s a quick example. Someone visits your site five times over two weeks. On the fifth visit, they buy something.
| Metric | Calculation | Result |
|---|---|---|
| Session key event rate | 1 purchase ÷ 5 sessions | 20% |
| User key event rate | 1 user converted ÷ 1 user | 100% |
Same person. Same purchase. Two very different percentages.
When to use session-based rate: Campaign analysis. If you want to know which landing pages or ad campaigns drive immediate action, session rate is your metric. It answers “what percentage of visits convert?”
When to use user-based rate: Longer sales cycles. If your customers visit three, five, or ten times before buying (common in B2B and SaaS), user rate is more honest. It answers “what percentage of people eventually convert?”
Neither is “right.” They just answer different questions.
One more quirk. In Universal Analytics, the “All Goals” conversion rate could go above 100%. If someone completed three different goals in one session, each one counted. GA4’s individual key event rates don’t have this problem, because each rate measures one specific key event.
Building a goal hierarchy: macro, micro, and process goals
Most people skip this part. Don’t.
Avinash Kaushik was Google’s Analytics Evangelist (yes, that was his actual title). His point was simple: if your purchase conversion rate is 2%, what are the other 98% of visitors doing? You have no idea unless you’re tracking more than just the final purchase.
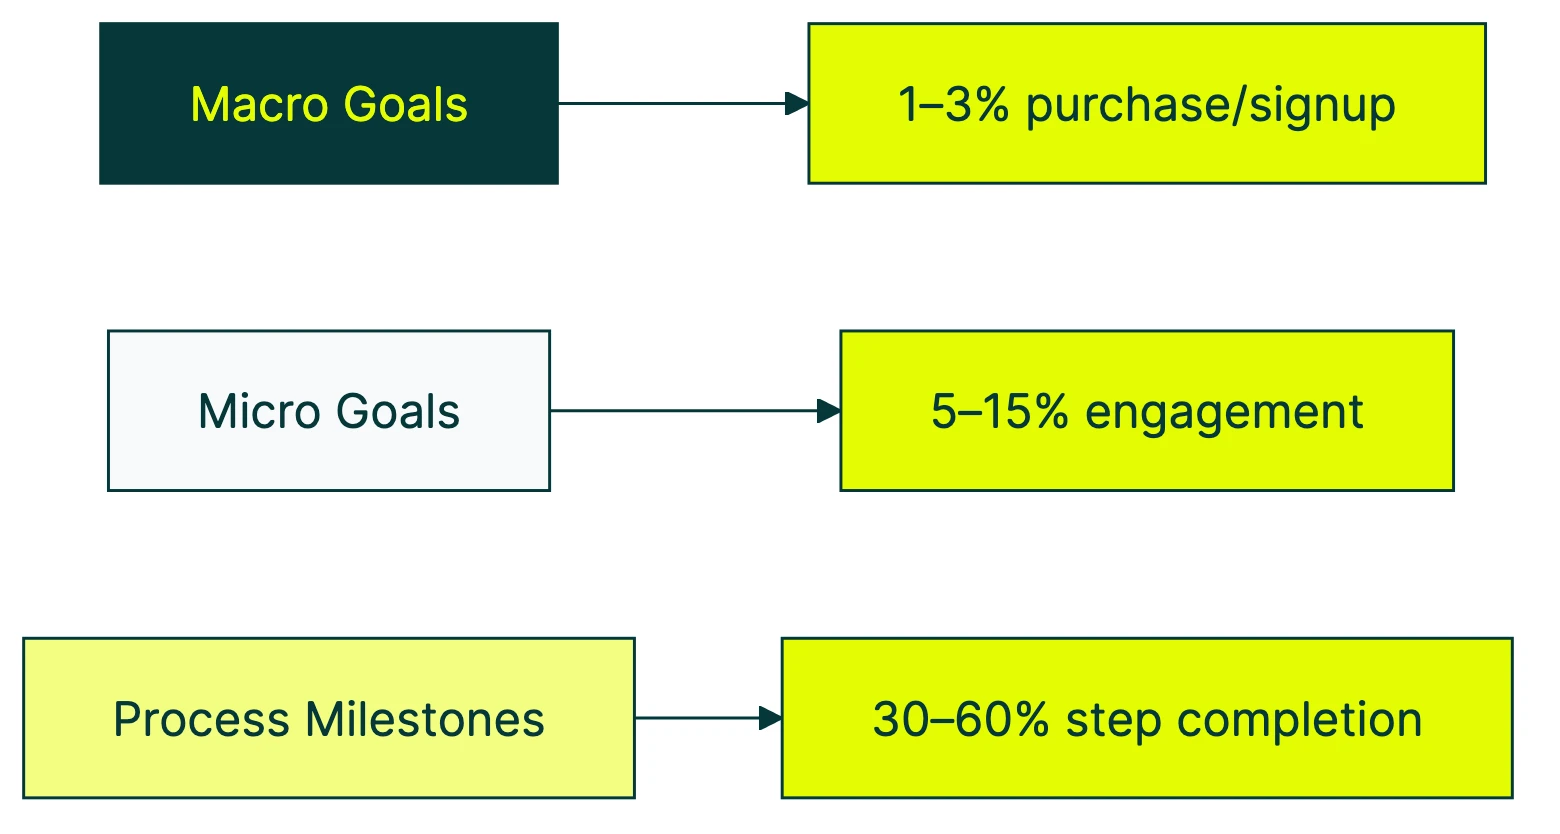
That’s where a goal hierarchy comes in. There are three levels:
Macro goals are the ones tied directly to revenue. Purchases. Paid signups. Demo bookings. These are the goals your boss asks about.
Micro goals are actions that signal intent. Newsletter signups. Pricing page visits. PDF downloads. Video watches. These people aren’t buying yet, but they’re interested. Nielsen Norman Group’s research calls these “secondary actions,” and they’re where most of your optimization clues live.
Process milestones are steps along the conversion funnel. Add to cart. Begin checkout. Create account. These tell you where people drop off.
Here’s a practical template for three common business types:
| Ecommerce | SaaS | Lead gen | |
|---|---|---|---|
| Macro goals | Purchase, repeat purchase | Paid signup, plan upgrade | Form submission, phone call |
| Micro goals | Wishlist add, email signup, product review view | Pricing page visit, feature page visit, blog-to-signup click | Resource download, newsletter signup, chat start |
| Process milestones | Add to cart, begin checkout, enter payment | Create account, start trial, complete onboarding | Visit contact page, start form, select service |
When you run A/B tests, pick one primary goal to measure. Your macro goal is almost always the right choice. It’s the one tied to revenue. But tracking micro goals alongside it helps you understand why a test won or lost.
For example, maybe Version B of your landing page gets fewer purchases but more pricing page visits. That tells you the page is generating interest but losing people at the price. Different story than “Version B lost.” Different action, too. You can set up a free test like this in about three minutes.
Kirro picks up your GA4 key events automatically as test goals, so you can measure tests against the same goals you’re already tracking.
How many goals should you track?
Practitioners generally recommend 5 to 10 meaningful goals. More than that creates noise. Less than that leaves blind spots.
The test from Portent is simple: “If you can’t show how a visitor completing this goal impacts revenue, it’s probably too generic.” Tracking “page view” as a key event, for example, inflates your numbers without telling you anything useful.
NNGroup recommends starting from the other direction: define what success looks like for your visitors first, then find metrics that match. Most teams do it backwards. They track what’s easy to measure, then try to explain why it matters. Start with the question. Then find the number.
This framework ties directly to the broader CRO metrics that actually drive conversions. For a deeper look at the conversion rate metrics hierarchy and how individual rate metrics ladder up to business outcomes, we wrote a dedicated guide.
What is a good goal conversion rate?
“What’s a good goal conversion rate?” is one of the most common questions in analytics. And the honest answer is: it depends on the goal.
A purchase goal and a newsletter signup goal have completely different baselines. Comparing them is like comparing your car’s speed to your microwave’s wattage. Both are numbers. Neither helps you understand the other.
Here’s what the data says, broken down by context:
| Context | Median/Average | Source |
|---|---|---|
| B2C websites (all goals) | 2.19% median | Databox survey, 89 companies |
| B2B websites | 2.3% median | Databox |
| SaaS | 2.09% median | Databox |
| Landing pages | 6.6% median | Unbounce, 464M visits |
| Google Ads campaigns | 7.52% average | WordStream, 16K accounts |
| Cross-industry (all sites) | 2.35% average | Invesp |
The cross-industry average of 2.35% gets thrown around a lot. But the top 25% of companies achieve 5.31% or higher, and the top 10% hit 11%+. So “average” isn’t a target. It’s a floor.
For a deeper breakdown by industry, platform, and traffic source, see our good conversion rate benchmarks by industry. If you’re setting goals for a mobile app, the average app conversion rates by category are a better reference point than web benchmarks.
One thing benchmarks don’t tell you: traffic quality matters more than almost anything on the page. Contentsquare’s 2025 benchmark report found that companies pouring money into paid social saw their conversion rates drop 10.6%. Nothing else changed. Just worse traffic. Sometimes the fastest way to improve your goal conversion rate is to stop paying for visitors who were never going to buy.
How to improve your goal conversion rate
Before you try to improve a number, make sure the number means something. If your goal hierarchy (from the section above) isn’t set up, do that first. No point improving a rate if you’re measuring the wrong goal.
Once your tracking is solid, ask three questions:
1. What’s bringing people to your site?
Check your landing page reports in GA4. Look at which traffic sources drive sessions with the highest key event rates. Double down on what’s working. Cut what isn’t.
Here’s a number that might change your priorities: companies spend $92 on getting visitors for every $1 they spend on converting them. That’s like spending $92 on ingredients and $1 on actually cooking the meal.
2. Where are people dropping off?
Use GA4’s funnel exploration to see where visitors abandon the process. Are they leaving at checkout? At the form? At the pricing page?
If you want to go deeper, run a CRO audit to find the biggest leaks. Session replay tools can show you exactly where people get stuck.
3. What convinces the people who do convert?
This one’s underrated. Study your converters, not just your bouncers. Post-purchase surveys, exit-intent popups, and chat transcripts all reveal what finally pushed someone to act.
Once you have answers to those three questions, A/B testing your conversion rate becomes way more effective. You’re not guessing what to test. You’re testing the things that data says matter.
Start with high-impact elements: headlines, calls to action, form length, and page layout. These CRO best practices cover the specifics.
The macro trend reinforces this. Contentsquare’s 2025 data shows conversion rates dropped 6.1% year-over-year while cost per visit surged 9%. Traffic is getting more expensive and less likely to convert. Improving your goal conversion rate is cheaper (and more sustainable) than buying more traffic.
If you want to test what actually moves your goal conversion rate, try Kirro free for 30 days. It picks up your GA4 key events as test goals, so you’re measuring tests against the conversions you already care about. See how it works.
From there, build a full conversion rate optimization game plan. Pair your goal hierarchy with a CRO strategy and start testing your conversions systematically. Optimizing your landing pages is usually the best place to start, and a clear conversion optimization strategy keeps you from running tests at random.
FAQ
What is a goal conversion rate?
Goal conversion rate is the percentage of sessions (or visitors) where someone completed a specific goal on your website. The formula: (goal completions ÷ total sessions) × 100. If 2,000 sessions produced 50 signups, your signup goal conversion rate is 2.5%.
In GA4, this metric is called “session key event rate.” You can also measure it per user (not per session) using “user key event rate.”
How do I calculate goal conversion rate?
Take the number of times a goal was completed. Divide it by total sessions. Multiply by 100.
Example: 75 form submissions ÷ 3,000 sessions = 2.5% goal conversion rate.
If you want per-user instead of per-session, divide completions by unique users. This is more useful for products with long sales cycles where people visit multiple times before converting.
Is a 2.5% conversion rate good?
For purchase goals, 2.5% is above average (the cross-industry median is around 2.35%, per Invesp). For email signups or landing page goals, 2.5% is below average. Landing pages typically convert at 6.6% (Unbounce benchmark).
The better question: is 2.5% higher or lower than last month? Your own trend line matters more than industry averages.
How do I set conversion goals in GA4?
In GA4, go to Admin, then Events. Find the event you want to track (like a form submission or purchase) and toggle “Mark as key event.” Any event can become a key event. You don’t need to write code to do this if the event is already being collected.
GA4 gives you up to 30 key events. Our GA4 conversion rate guide walks through the full setup.
What’s the difference between goal conversion rate and overall conversion rate?
Goal conversion rate measures one specific action (like newsletter signups). Overall conversion rate either aggregates all goals together or refers to the site’s primary conversion (usually purchases).
Tracking individual goal conversion rates gives you more actionable data. A 3% overall rate doesn’t tell you where to improve. But knowing that your signup rate is 4% while your demo request rate is 0.5% tells you exactly where to focus. That specificity is what makes a good set of CRO metrics actually useful.
Does “goal conversion rate” mean the same thing in sports?
If you found this page looking for football stats, here’s the quick version: in soccer, goal conversion rate measures goals scored divided by total shots taken. A good striker converts around 15 to 20% of shots. Different sport, same basic math (successful outcomes ÷ total attempts × 100).
This article is about website analytics. But you already figured that out.

Randy Wattilete
CRO expert and founder with nearly a decade running conversion experiments for companies from early-stage startups to global brands. Built programs for Nestlé, felyx, and Storytel. Founder of Kirro (A/B testing).
View all author posts