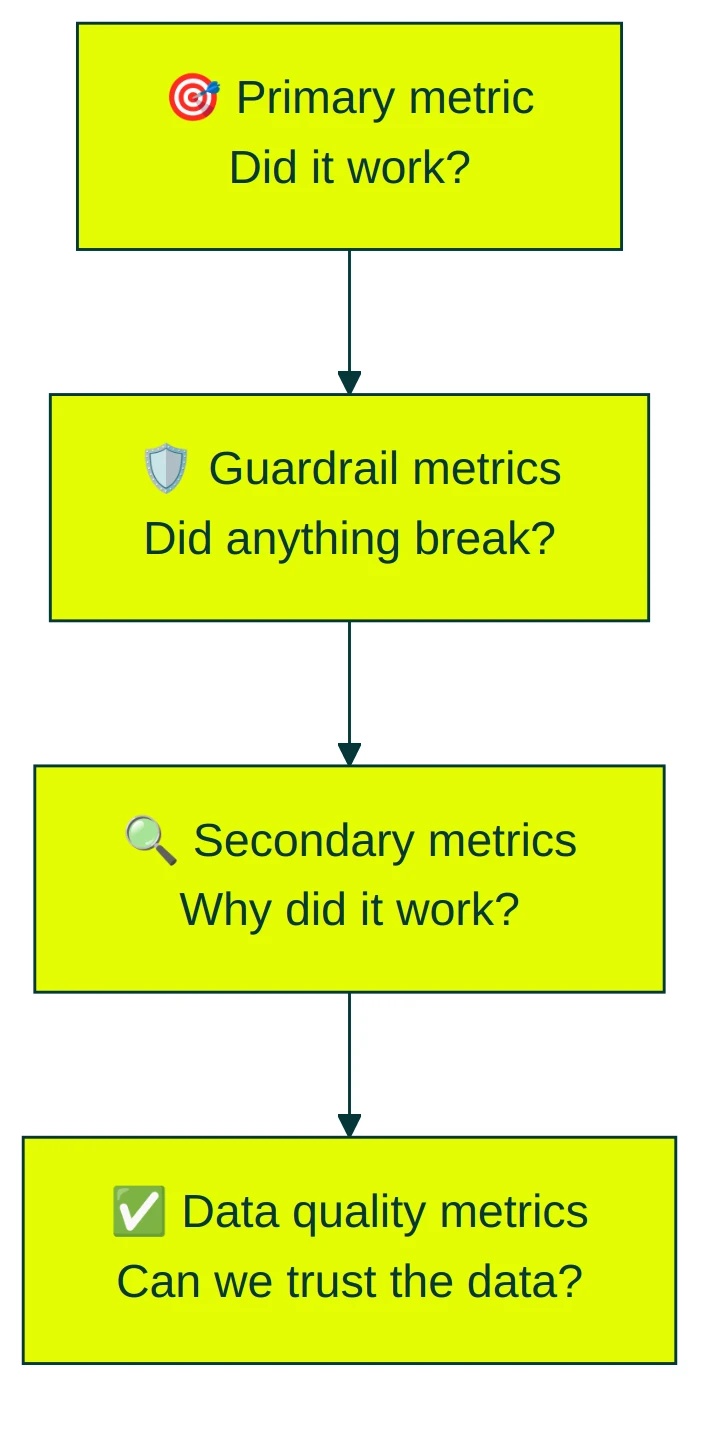
A/B testing metrics fall into four categories: primary metrics (did Version B win?), guardrail metrics (did anything break?), secondary metrics (why did it win?), and data quality metrics (can we trust the numbers?). Most guides give you a flat list of 10 metrics and tell you to track them all. That’s not how teams who run thousands of tests think about measurement.
Teams at Microsoft, Airbnb, and Booking.com organize their metrics into tiers. One primary metric, a few safety checks, and supporting metrics to understand what happened. That structure is what separates a test that teaches you something from one that just burns traffic.
Here’s the framework, which metrics belong in each category, and how to avoid the mistakes that make 80% of A/B tests end without a clear answer.
The 4 types of A/B testing metrics (and why categories matter more than lists)
Every other article on A/B testing metrics gives you a flat list. Conversion rate, bounce rate, revenue, CTR, session duration. All treated as equals. Pick whichever you like.
That’s like saying “track everything” which really means “track nothing well.” The teams who actually get results from testing use a hierarchy. It comes from Ron Kohavi’s research at Microsoft, where they run tens of thousands of tests per year. He calls the top metric your “north star number” (the academic term is Overall Evaluation Criterion, but nobody needs to remember that).
Here’s how the four categories work together:
This taxonomy comes from a 2024 research paper on risk-aware product decisions. It formalized what Microsoft and Netflix had been doing internally for years. Not complicated. But it changes how you think about every test.
If you’re already tracking CRO metrics across your site, this framework shows you which ones matter specifically for A/B tests. And if you’re running multivariate tests (testing multiple changes at once), the same categories apply.
Primary metrics: what to measure first
Your primary metric decides the winner. One metric. Not three, not seven. One.
This is where most people go wrong, especially product managers juggling multiple stakeholders. (Our product management A/B testing guide covers how PMs handle metric selection and stakeholder alignment.) They track five metrics, find that two improved and three didn’t, and spend a week debating what it means. Kohavi’s research is clear: pre-register one primary metric before you launch. Everything else is supporting evidence.
The most common primary metrics for conversion rate A/B testing:
- Conversion rate (percentage of visitors who do the thing you care about). The default for most businesses. If you’re not sure what to pick, start here.
- Revenue per visitor. Better for ecommerce when average order values vary a lot. A test might lower conversion rate but increase revenue because buyers spend more. This metric is especially important when running pricing experiments and revenue metrics side by side.
- Click-through rate. Best for emails, ads, and top-of-funnel pages where the goal is “get them to click.” Our click-through rate benchmarks by industry can help you set a realistic target.
- Engagement metrics (time on page, scroll depth, pages per session). Good for content sites and early-stage products where “conversion” isn’t clearly defined yet.
The decision is simpler than it sounds: pick the metric closest to your business goal that your traffic can actually move. Percentages are usually better than raw numbers because they adjust for traffic differences between test versions. When you’re testing UX changes specifically, the right primary metric often differs from what you’d track in a pure conversion test — our guide to UX-specific A/B testing metrics goes into detail on this.
Our take: If you’re a small business, start with conversion rate. It’s easy to understand, easy to explain to your boss, and sensitive enough for most traffic levels. You can set up a test in Kirro with conversion rate as your primary metric in about three minutes.
Guardrail metrics: what you can’t afford to break
A Bing engineering team shipped a feature that increased search queries per user by 10%. Looks great, right? More engagement. Ship it.
Except the feature was broken. It was returning bad search results, which forced people to search again. And again. The queries-per-user metric went up because the experience got worse. Without guardrail metrics, they would have celebrated a bug as a win.
Guardrails are metrics that must not get worse, even if your primary metric improves. You watch them to make sure your test isn’t secretly breaking something else.
Common guardrail metrics:
- Page load time. Slower pages kill everything else. If your test adds weight to the page, you’ll see it here.
- Error rate. Are more people hitting broken states?
- Bounce rate (percentage of visitors who leave without doing anything). If your primary metric is conversion rate, bounce rate tells you if you’re scaring people off.
- Revenue (when revenue isn’t your primary metric). A headline test might boost signups but attract people who never pay.
Kirro shows guardrail metrics alongside your primary metric on the same screen. You don’t have to dig through separate reports or remember to check them. They’re just there, quietly keeping you honest while you focus on the result.
Most guides skip guardrails entirely. The concept comes from teams running thousands of tests, not marketing blogs. But it’s the single most important thing separating a useful test from a misleading one.
Secondary metrics: the diagnostic layer that explains your results
Your primary metric tells you if something worked. Secondary metrics tell you why.
Say your new homepage headline increases signups by 15%. Great. But secondary metrics reveal the full picture.
Did average session duration go up too? People might be reading more because the headline set better expectations. Did cart abandonment spike? Maybe the headline attracted the wrong crowd.
Good secondary metrics for most tests: scroll depth (are people actually reading?), average session duration (longer can mean engaged, but also confused), average order value, cart abandonment rate (the gap between “interested” and “bought”), and retention rate. These are the numbers you’ll reference when someone asks “okay, but why did it win?”
The key rule: you never ship based on secondary metrics alone. They’re the supporting cast. If signups increase but time-on-page drops, visitors might be signing up faster (good) or bouncing and signing up elsewhere (less good). Secondary metrics surface these distinctions.
Booking.com’s experimentation team digs into what’s really driving each result (researchers call this mediation analysis). Borrow that habit, even at a smaller scale.
If you want a deeper look at which conversion metrics to track beyond testing, our conversion rate metrics guide covers the full picture.
How to read your A/B testing analytics dashboard
Most A/B testing dashboards throw a wall of numbers at you. Here’s what actually matters, translated into plain English:
Confidence (how sure we are this isn’t random luck). That percentage next to your result? 95% confidence means there’s only a 5% chance the difference happened by accident. Our guide on false positives and false negatives goes deeper.
Lift (how much better Version B performed). Two flavors: relative and absolute. If your conversion rate went from 3% to 4%, the absolute lift is 1 percentage point. The relative lift is 33%. Both are true. But “33% improvement” sounds way more impressive than 1 extra conversion per 100 visitors.
Sample progress (how many visitors you need before the result is reliable). Most tests need thousands of visitors, not hundreds. If your dashboard shows a winner after 200 visitors, don’t trust it. Our sample size formula guide helps you figure out how long to run.
When to stop. When your dashboard says so, not before. Checking results daily and stopping when it “looks good” is called peeking, and it inflates your false positive rate. Sequential testing methods let you check early without messing up the math.
Kirro uses math that works with less traffic (experts call this Bayesian statistics). Instead of a confusing yes/no answer, you get a probability: “Version B has an 89% chance of getting more signups.” Plain English. No null hypothesis required.
If you want to see what this looks like in practice, Kirro’s dashboard shows your primary metric, confidence, guardrails, and sample progress on one screen.
Why 80% of A/B tests are inconclusive (and how better metrics fix it)
The numbers are brutal. Optimizely analyzed 127,000 experiments and found only 12% produced a significant improvement. A separate CXL analysis of 28,304 experiments found 80% were inconclusive. Only 1 in 7.5 showed a lift greater than 10%.
It gets worse. Optimizely found that 90% of teams target the same five common metrics. Three of those five have the lowest business impact. Teams aren’t just failing tests. They’re picking the wrong metrics to test against.
The reason? Metric sensitivity (how easily a metric can detect a real change). Some metrics are noisy. They bounce around so much day-to-day that even a real improvement gets lost in the noise. Others are stable enough that a small change shows up clearly.
Two things that make a metric more sensitive:
- Rate metrics beat count metrics. “Percentage of visitors who signed up” is more sensitive than “total signups” because it adjusts for traffic swings. This comes from Microsoft’s experimentation research.
- Metrics closer to the change detect effects faster. Changed a headline? Click-through rate on that page will show a difference before overall revenue does.
For small businesses with limited traffic, this matters more than anything else in this article. Pick a metric that’s too noisy for your visitor count and you’ll wait months for an answer that never comes. Pick one that’s sensitive enough and you’ll know in weeks.
Research on learned metrics showed a 78% increase in statistical power (your test’s ability to spot a real difference). In practical terms? Same quality answer with roughly 12% of the visitors.
Our take: This is the biggest reason small businesses waste time on A/B testing. They pick revenue as their primary metric, wait six weeks, and get nothing. Switch to a more sensitive metric (like click-through rate on the changed element) and you’d have your answer in two weeks. Also consider variance reduction techniques like CUPED if you need every visitor to count.
5 metric mistakes that waste your A/B test
These five mistakes show up in almost every team we’ve talked to. They’re fixable once you see them.
1. Tracking a metric that doesn’t tie to business value
Remember the Bing bug story? Queries-per-user went up. Engagement looked great. But the actual user experience was broken. Always ask: “If this metric improves, does my business actually get better?” If the answer isn’t obvious, pick a different metric.
2. Using too many primary metrics
Test against five metrics at once and you have a roughly 23% chance of seeing a fake win on at least one. The more metrics you check, the more likely random noise looks real (statisticians call this the multiple comparison problem). One primary metric. Everything else is guardrail or secondary. For more on how this works, see our guide on Type 1 vs Type 2 errors.
3. Ignoring guardrails entirely
Your new checkout flow increased purchases by 8%. But error rate also went up 3x. Without guardrails, you ship the broken checkout and wonder why refund requests spike two weeks later.
4. Reporting relative lift without absolute difference
“We improved conversions by 50%.” Sounds amazing. But if conversion rate went from 0.2% to 0.3%, that’s one extra conversion per thousand visitors. Always report both numbers. Context matters.
5. Not pre-registering your primary metric
If you pick your primary metric after seeing the results, you’re not testing. You’re storytelling. Kohavi recommends deciding your primary metric before you launch, writing it down, and not changing it. This prevents the very human tendency to find a “win” in whatever metric happened to move.
For the full list of testing pitfalls (not just metric-related ones), see our guide on common A/B testing mistakes. And if you want to go the other direction and learn what to do right, our A/B testing best practices guide covers the process side.
FAQ
What are the metrics for A/B testing?
A/B testing metrics fall into four categories. Primary metrics (conversion rate, revenue per visitor, CTR) decide the winner. Guardrail metrics (page load time, error rate, bounce rate) make sure nothing breaks. Secondary metrics (scroll depth, session duration, average order value) explain why the result happened. Data quality metrics (sample ratio mismatch, bot traffic percentage) verify that your test data is trustworthy. Running an A/A test to verify metric accuracy before launching real experiments is one of the best ways to catch data quality problems early.
How do you measure A/B test results?
Compare your primary metric between Version A and Version B. Check that confidence is above 95% (or above 90% probability if you’re using Bayesian stats). Verify guardrail metrics didn’t get worse. Then look at secondary metrics to understand the full story. Our guide on measuring A/B testing conversion rates covers the specifics.
What are some common testing metrics?
The most common: conversion rate, click-through rate, bounce rate, revenue per visitor, average order value, session duration, scroll depth, retention rate, error rate, and page load time. But tracking all of them as primary metrics is a mistake. Pick one primary. Set 2-4 guardrails. Use the rest as secondary.
How many metrics should I track in an A/B test?
One primary metric, 2-4 guardrail metrics, and a handful of secondary metrics. More than that creates noise and increases your chance of false positives. Kohavi’s research recommends picking one primary metric before launch. Everything else is supporting evidence. Our guide on how to design a marketing experiment walks through this step by step, and our A/B test tracking template gives you a spreadsheet format for organizing metrics across tests.
What’s the difference between primary and secondary metrics?
Primary metrics decide the winner. You ship (or don’t ship) based on the primary metric. Secondary metrics explain why it happened. You don’t make shipping decisions on secondary metrics alone, but they tell you the story behind the numbers and help you plan better tests in CRO testing.

Randy Wattilete
CRO expert and founder with nearly a decade running conversion experiments for companies from early-stage startups to global brands. Built programs for Nestlé, felyx, and Storytel. Founder of Kirro (A/B testing).
View all author posts