An ecommerce CRO audit is a structured walkthrough of your store that finds exactly where you’re losing sales. Not vague “maybe try a different button color” advice. A real diagnostic process: check the numbers, spot the leaks, fix the ones that matter most.
Think of it like a doctor’s checkup for your online store. You don’t guess what’s wrong. You run the tests, look at the results, then treat the actual problem. This guide gives you the full seven-step process, with benchmarks to compare against and specific things to check on every page.
The average online store loses 70% of its shopping carts before anyone hits “buy.” That’s money walking out the door. An audit finds the door.
What an ecommerce CRO audit actually is (and isn’t)
A CRO audit and CRO optimization are two different things. The audit is the diagnosis. Optimization is the treatment. You wouldn’t skip the X-ray and go straight to surgery. Same idea here.
During an audit, you’re not changing anything yet. You’re gathering evidence: which pages leak the most visitors, where people get stuck, what your customers actually complain about. Then you prioritize fixes based on what will make you the most money.
If you’re looking for the bigger picture of what ecommerce CRO covers and why it matters, start there. This post is the hands-on part. The “give me a checklist I can run on my store today” part.
Our take: Most audit guides tell you to “review your checkout experience.” That’s like telling a mechanic to “check the car.” We’ll tell you exactly which bolts to look at.
The ecommerce CRO checklist: 7-step audit process
This is the full ecommerce conversion checklist, from baseline numbers to final testing plan. You can run it on any platform (Shopify, WooCommerce, BigCommerce, custom). There’s a Shopify-specific section further down, and for open-source platforms, our guide on Magento conversion rate optimization covers the audit steps specific to Magento, WooCommerce, and BigCommerce.
Step 1: Benchmark your numbers before you touch anything
Before you diagnose problems, you need a baseline. Open your analytics tool (likely GA4) and pull these numbers for the last 90 days:
- Overall conversion rate (the percentage of visitors who buy something)
- Add-to-cart rate (the percentage who add an item to their cart)
- Checkout start rate (the percentage who begin checkout)
- Purchase completion rate (the percentage who actually finish paying)
Now segment by device. Mobile and desktop convert very differently. Contentsquare’s 2026 benchmarks put desktop retail at about 3.7% and mobile at 2.0%. That’s nearly half. And mobile makes up 70% of your traffic.
Here’s how to know if your numbers are good, bad, or somewhere in between:
| Category | Average CVR | Top 20% |
|---|---|---|
| Food and beverage | 4.5–6% | 8%+ |
| Beauty and personal care | 3–5% | 7%+ |
| Fashion and apparel | 2–3% | 5%+ |
| Home and furniture | 1–2% | 3%+ |
| Luxury and jewelry | 0.8–1.2% | 2%+ |
| All Shopify stores | 1.4% | 3.2%+ |
Sources: Contentsquare, Littledata
Also segment by traffic source. Paid, organic, email, and social all convert at wildly different rates. Pouring money into paid social and wondering why your conversion rate is tanking? That might be the answer. Contentsquare found paid social drove 12% more traffic in 2025, but bounce rates went up 9.2% and conversions dropped 10.6%.
For the full GA4 setup, see our guide on tracking ecommerce conversions in GA4. And if you want a deeper look at which CRO metrics to track beyond conversion rate, that guide breaks it all down.
Step 2: Find your biggest leak (funnel drop-off analysis)
Your checkout funnel looks something like this:
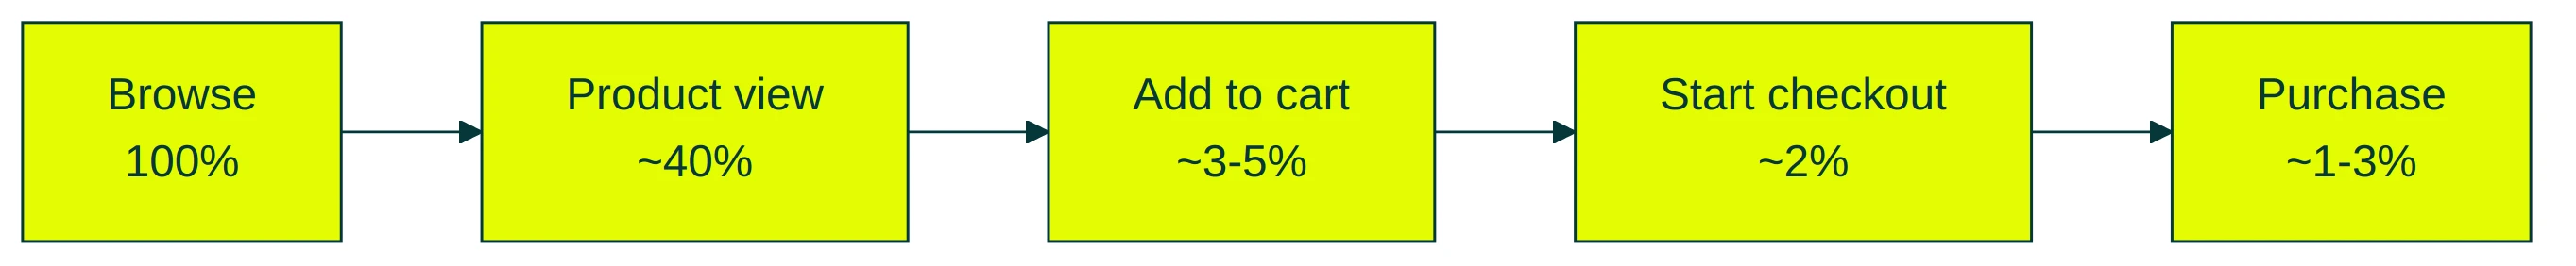
Most store owners obsess over checkout abandonment. And yes, the average cart abandonment rate is 70%. But most guides skip the bigger number: the biggest drop-off usually happens way before checkout.
About 95–97% of visitors leave without adding anything to their cart. That’s where the real money disappears.
Build Grow Scale, an agency that’s audited hundreds of Shopify stores, puts it this way: “In 80% of cases, the biggest revenue leak is not where the operator thinks it is.”
Open GA4’s funnel exploration report. Map your actual steps: landing page, product view, add to cart, checkout started, purchase complete. Find your biggest percentage drop. That’s your priority, not the step you assumed was broken.
IMRG (the UK’s ecommerce industry body) puts it bluntly: “Poor-quality traffic drives poor conversion rates, regardless of how well your site is optimised.” If you’re sending top-of-funnel blog readers to product pages, no audit fixes that. It’s a traffic problem. Segment your funnel analysis by traffic source to spot this.
For a deeper look at how conversion funnels work stage by stage, that guide walks through it all.
Step 3: Audit your page speed and technical health
Speed has the strongest data behind it. A joint study by Google, Deloitte, and Fifty-Five analyzed 30 million sessions across 37 brand websites. They changed nothing except speed. A 0.1-second improvement lifted retail conversions by 8.4% and average order value by 9.2%.
Speed was the only variable. No redesign. No new copy. Just faster pages.
Google’s own research found that bounce probability jumps 90% when load time goes from 1 second to 5 seconds. And the surprise? More images was the second greatest predictor of lower conversions. Not because images are bad. They just slow things down. Compression matters more than quantity.
What to check:
- Run PageSpeed Insights on your homepage, top product page, and checkout page
- Look at LCP (how fast your main content loads), CLS (how much the page jumps around while loading), and INP (how quickly the page responds when someone taps or clicks)
- If your mobile LCP is above 2.5 seconds, that’s your quick win
If pages with lots of elements load slowly, that’s killing conversions. Google found pages with 6,000 elements versus 400 had a 95% drop in conversion probability. Strip what you don’t need.
Step 4: Review each page type for conversion friction
This is the page-by-page ecommerce conversion checklist. Not “make it look nice.” Specific things to check.
Homepage:
- Does your value proposition hit within 3 seconds of landing?
- Can a first-time visitor tell what you sell and why they should buy from you?
- Is navigation clear enough that someone could find a product in two clicks?
Category and collection pages:
- Do filters actually work? (Test them yourself on mobile.)
- Are product cards clear enough to make a decision without clicking through?
- Does sorting make sense for how your customers shop?
Product pages:
- Are reviews visible near the price and buy button? Baymard Institute found that 82% of ecommerce sites have severe UX issues on product pages. 43% don’t show shipping costs at the product level. That’s a fix you can make today.
- Is the add-to-cart button obvious on mobile without scrolling?
- Is there a trust signal (return policy, guarantee, security badge) near the buy button? A ConversionTeam A/B test found adding Norton security badges increased conversions by 12.2%.
Cart page:
- Are there any surprise costs that weren’t visible on the product page? (This is the #1 reason people abandon carts, according to Baymard: 48% of shoppers leave because of unexpected costs.)
- Is the “proceed to checkout” button the most prominent thing on the page?
Checkout:
- Can people check out as a guest? (26% of shoppers abandon when forced to create an account.)
- How many form fields are there? Baymard’s 2024 research found the average checkout has 11.3 form fields. The sweet spot is 7–8. Every field beyond that drops your completion rate by 4–6%.
- Are the major payment options visible (credit card, PayPal, Apple Pay, Google Pay)?
For deep dives on specific pages, check out ecommerce product page design best practices, product page optimization, and checkout optimization best practices.
Step 5: Listen to your customers (qualitative data)
Analytics tells you what’s happening. Your customers tell you why.
Most audit guides tell you to “do qualitative research” and leave it at that. Here’s what that actually looks like:
Mine your reviews. Read every product review from the last 6 months. Look for patterns: what objections come up, what almost stopped people from buying. One jewelry brand found 87% of reviews cited pricing transparency as the #1 purchase motivator. The brand’s entire positioning focused on design. That’s a gap no heatmap would ever show.
Check your support tickets. The questions people ask before buying reveal the information your site fails to provide. If 20 customers asked about your return policy last month, your return policy is either hidden or unclear.
Send a post-purchase survey. One question is enough: “What almost stopped you from buying today?” The answers will surprise you. Customers will tell you about friction your analytics never captured.
One surprising finding: products with perfect 5-star ratings actually convert worse than products rated 4.0–4.7. Shoppers assume perfect ratings are fake. If you’re filtering out anything below 5 stars, stop.
And remember that context matters. A conversion rate drop in November might mean a broken checkout. Or it might just mean you ran fewer promotions than last year. Listen to the numbers and the people behind them.
Our take: If you only do one thing from this entire audit, do this step. The number of stores that have never read their own reviews in bulk is staggering. It takes an hour and it changes everything.
Step 6: Score and prioritize what you found
By now you’ve probably found a dozen problems. Good. But you can’t fix everything at once, and not all problems are equal.
Use a simple scoring method: rate each issue on impact (1–5) and ease (1–5), then multiply. A checkout field reduction that affects every buyer (impact: 5) and takes an afternoon to implement (ease: 4) scores 20. A homepage hero image swap (impact: 2, ease: 5) scores 10. Start with the high scores.
Prioritize by traffic volume too. A 1% improvement on a page that gets 50,000 visits beats a 5% improvement on a page with 1,000 visits. The math is simple but most people don’t do it.
Split your findings into two buckets:
- Quick fixes (deploy now): broken links, missing trust signals, hidden shipping costs, slow-loading images
- Test candidates (need A/B testing): headline changes, layout rearrangements, new CTAs, pricing presentation
Baymard estimates that better checkout design alone can lift conversion rates by 35.26% on average. If your checkout has obvious problems, start there.
Tools like Kirro can speed this up. It analyzes your pages against CRO frameworks and generates test suggestions with reasoning attached, so you’re not scoring from scratch.
For a full prioritization framework, see the CRO process guide.
Step 7: Test, don’t guess (or know when you can’t test)
Optimizely analyzed 127,000 experiments across their platform. Only 12% produced a statistically significant positive result on their primary metric. Most tests end in a draw or a loss.
Testing isn’t pointless. But it means the audit quality matters more than testing volume. Finding the right things to test is 90% of the work.
What actually moves revenue? A meta-analysis of 6,700 ecommerce experiments (audited by PricewaterhouseCoopers) found that cosmetic changes like button colors had minimal impact. The biggest lifts came from psychology-based changes: scarcity signals (+2.9% revenue per visitor), social proof (+2.3%), urgency cues (+1.5%).
Showing different things to different customer groups produced 3x more uplift than blanket changes. Personalization beats guessing.
So skip the button color test. Test the things your audit uncovered in Steps 4 and 5. The real friction points.
If you have enough traffic (25,000+ monthly visitors), A/B test your top-priority findings. Kirro analyzes your pages and suggests what to test based on CRO frameworks, turning audit findings into prioritized tests. Three minutes to set up your first one.
If you don’t have enough traffic, skip the A/B test and just implement the obvious fixes directly. A broken checkout form doesn’t need a statistical test. Fix it. Save testing for the changes where you genuinely don’t know which version will win.
Either way, audit again in 90 days. This stuff is a cycle, not a one-time project. For the testing methodology side, our A/B testing and conversion rates guide goes deeper.
The Shopify CRO audit: platform-specific checks
73% of global ecommerce sales come from mobile devices. Yet most store owners run their audits on a laptop. Do this entire audit on your phone first. You’ll catch problems you’d never spot on desktop.
Theme speed audit. Check your theme’s Lighthouse score with all apps disabled, then again with them enabled. The difference tells you how much your apps are costing you.
App bloat. The average 7-figure Shopify store runs 15–25 apps. Every app loads JavaScript. Each one slows your pages down a little. Go through your app list and ask one question: does this app make me more money than it costs in page speed? If you’re not sure, try disabling it for a week and watch what happens.
Zombie scripts. When you uninstall a Shopify app, it often leaves code behind in your theme.liquid file. These “zombie scripts” still load on every page, slowing things down for zero benefit. Check your theme code (or ask your developer to) for scripts from apps you no longer use.
If you haven’t enabled Shop Pay, you’re missing Shopify’s fastest checkout option. About 4 taps versus 120+ for a traditional form-based checkout. On mobile, that difference is massive.
Core Web Vitals update. Since March 2024, Google replaced FID with INP (how quickly your page responds to taps and clicks). If you haven’t audited since then, you might be failing Google’s page experience requirements without knowing it.
Script weight. While you’re auditing app bloat, check your A/B testing tool too. Most load 100-200KB of JavaScript. Kirro’s script is 9KB, so it won’t undo the speed gains you just fought for.
For a full set of tactical Shopify fixes, see our guide on how to increase your Shopify conversion rate. And for a plan-by-plan breakdown of what you can change on each Shopify tier, check out Shopify conversion rate optimization.
How often to run an ecommerce CRO audit
The short answer: every quarter. The longer answer depends on your situation.
At minimum, audit before every peak selling season. Black Friday, holiday season, back-to-school, whatever your big months are. You want problems fixed before the traffic shows up, not after.
Run an immediate audit when:
- Your conversion rate drops suddenly (more than 10% in a week)
- You launch a new theme or major redesign
- You add a significant new traffic source (new ad channel, influencer campaign)
- You install or remove multiple apps
Each audit builds on the last. Your Step 1 benchmarks from this quarter become the comparison for next quarter. Over time, you stop guessing and start seeing what’s actually improving. That’s the whole point.
Tools you need to run this audit
Free tier (gets you 80% of the way):
- GA4 for funnel data and traffic segmentation
- Google PageSpeed Insights for speed and Core Web Vitals
- Microsoft Clarity for heatmaps and session recordings (genuinely free, no limits)
For testing what you find:
- Kirro handles A/B testing and suggests what to test next based on what it learns from your results. The 9KB script won’t add to your app bloat problem (for comparison, most testing tools load 100–200KB). Start a free test once your audit is done.
If you want to go deeper:
- Hotjar or Lucky Orange for advanced heatmaps and feedback polls
- Baymard Premium if you want their full checkout benchmark database
For a full comparison of every tool in the category, see our roundup of the best CRO tools for ecommerce.
FAQ
What is an ecommerce CRO audit?
A structured review of your online store that finds exactly where you’re losing conversions. You check analytics, walk through each page type, listen to customer feedback, and prioritize fixes by revenue impact. The goal is diagnosis, not optimization. Figure out what’s broken, then fix it.
For more on the broader topic, see what is CRO.
How long does an ecommerce CRO audit take?
For a small to mid-sized store doing it yourself: one full day for data gathering (Steps 1–3), another day for page review and customer research (Steps 4–5). Prioritization and testing planning (Steps 6–7) take a few hours. Roughly 2–3 days of focused work total.
Professional agencies typically quote 1–2 weeks for a focused audit and 3–6 weeks for a deep one.
How much does a professional CRO audit cost?
Agency audits typically run $3,000–$15,000 depending on scope. That includes a full report with prioritized recommendations.
If that’s out of budget, this guide is the DIY version. Same process, free tools. What you’re paying an agency for is experience spotting patterns faster.
What’s the difference between a CRO audit and CRO optimization?
Audit = diagnosis. Optimization = treatment. You audit first to find the problems, then optimize to fix them. This guide covers the audit.
For the optimization side, see our guide on ecommerce conversion optimization. The CRO process guide covers going from findings to results.
Can I do a CRO audit with low traffic?
Yes. Steps 1 through 5 work with any traffic level. You can benchmark, map your funnel, check speed, review pages, and listen to customers regardless of visitor count.
The only step that needs significant traffic is Step 7 (A/B testing), which requires roughly 25,000+ monthly visitors for reliable results. Below that? Just implement the obvious fixes directly. A missing return policy or an 8-second load time doesn’t need a statistical test.

Randy Wattilete
CRO expert and founder with nearly a decade running conversion experiments for companies from early-stage startups to global brands. Built programs for Nestlé, felyx, and Storytel. Founder of Kirro (A/B testing).
View all author posts